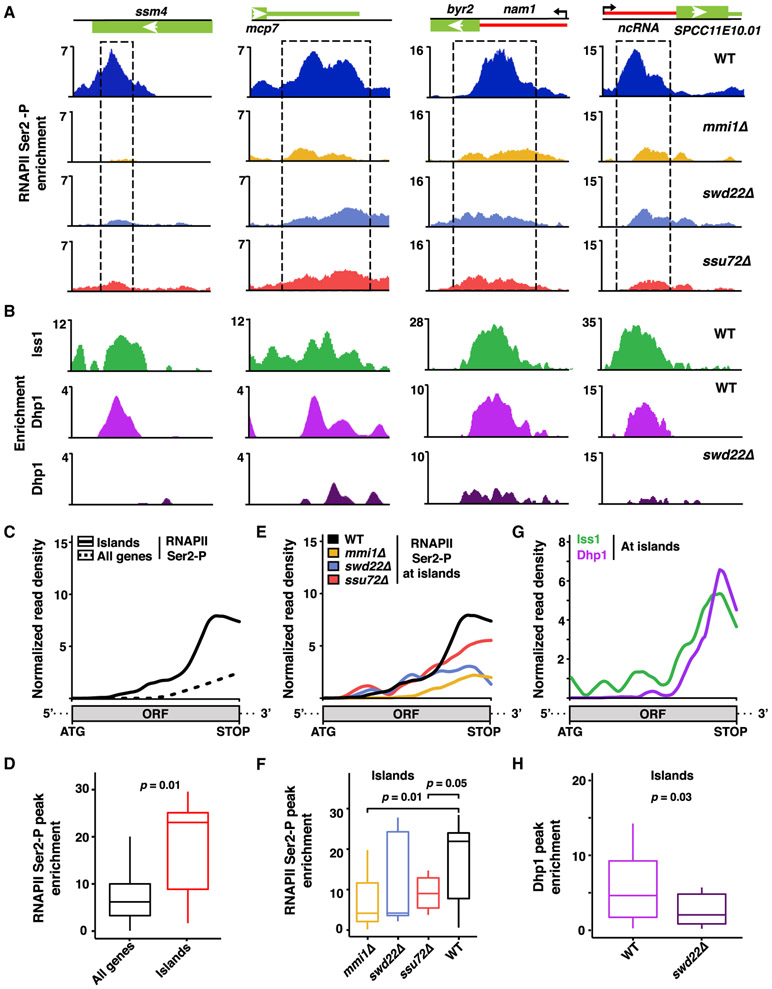
Figure 6. Mmi1 and the CPF Complex Promote RNAPII Pileup at Non-canonical Termination Sites.
(A) ChIP-seq analysis of RNAPII Ser2-P pileup at meiotic (ssm4 and mcp7) and lncRNA loci in the indicated strains. Dashed rectangles highlight regions of RNAPII Ser2-P pileup in the WT. Enrichment values represent the subtraction of WCE from IP.
(B) ChIP-seq localization distributions of the core CPF subunit Iss1FIP1 in the WT and of Dhp1XRN2 in the WT and swd22Δ.
(C) Median enrichment of RNAPII Ser2-P across island Mmi1-regulon genes (n = 7, solid black) or all coding genes (n = 5,144, dashed black) in the WT as determined by ChIP-seq.
(D) Boxplot of the RNAPII Ser2-P peak signals described in (C).
(E) Median enrichment of RNAPII Ser2-P across island Mmi1-regulon genes (n = 7) in the indicated strains.
(F) Boxplot of the RNAPII Ser2-P peak signals described in (E).
(G) Median enrichment of Iss1FIP1 and Dhp1XRN2 across island Mmi1-regulon genes (n = 7) in WT cells.
(H) Boxplot representation of Dhp1XRN2 peak signals in the WT and swd22Δ.
For all median distribution analyses, the base coordinate ranges of genes were scaled to a common length from start codon to stop codon. For boxplots, middle lines indicate median values, box edges indicate the first and third quartiles, and whiskers mark extreme values. p values were calculated using Wilcoxon signed rank test (one-tailed) for paired sets between WT and mutant or Wilcoxon rank sum test (one-tailed) for unpaired sets. Island Mmi1-regulon genes are listed in Table S3.

