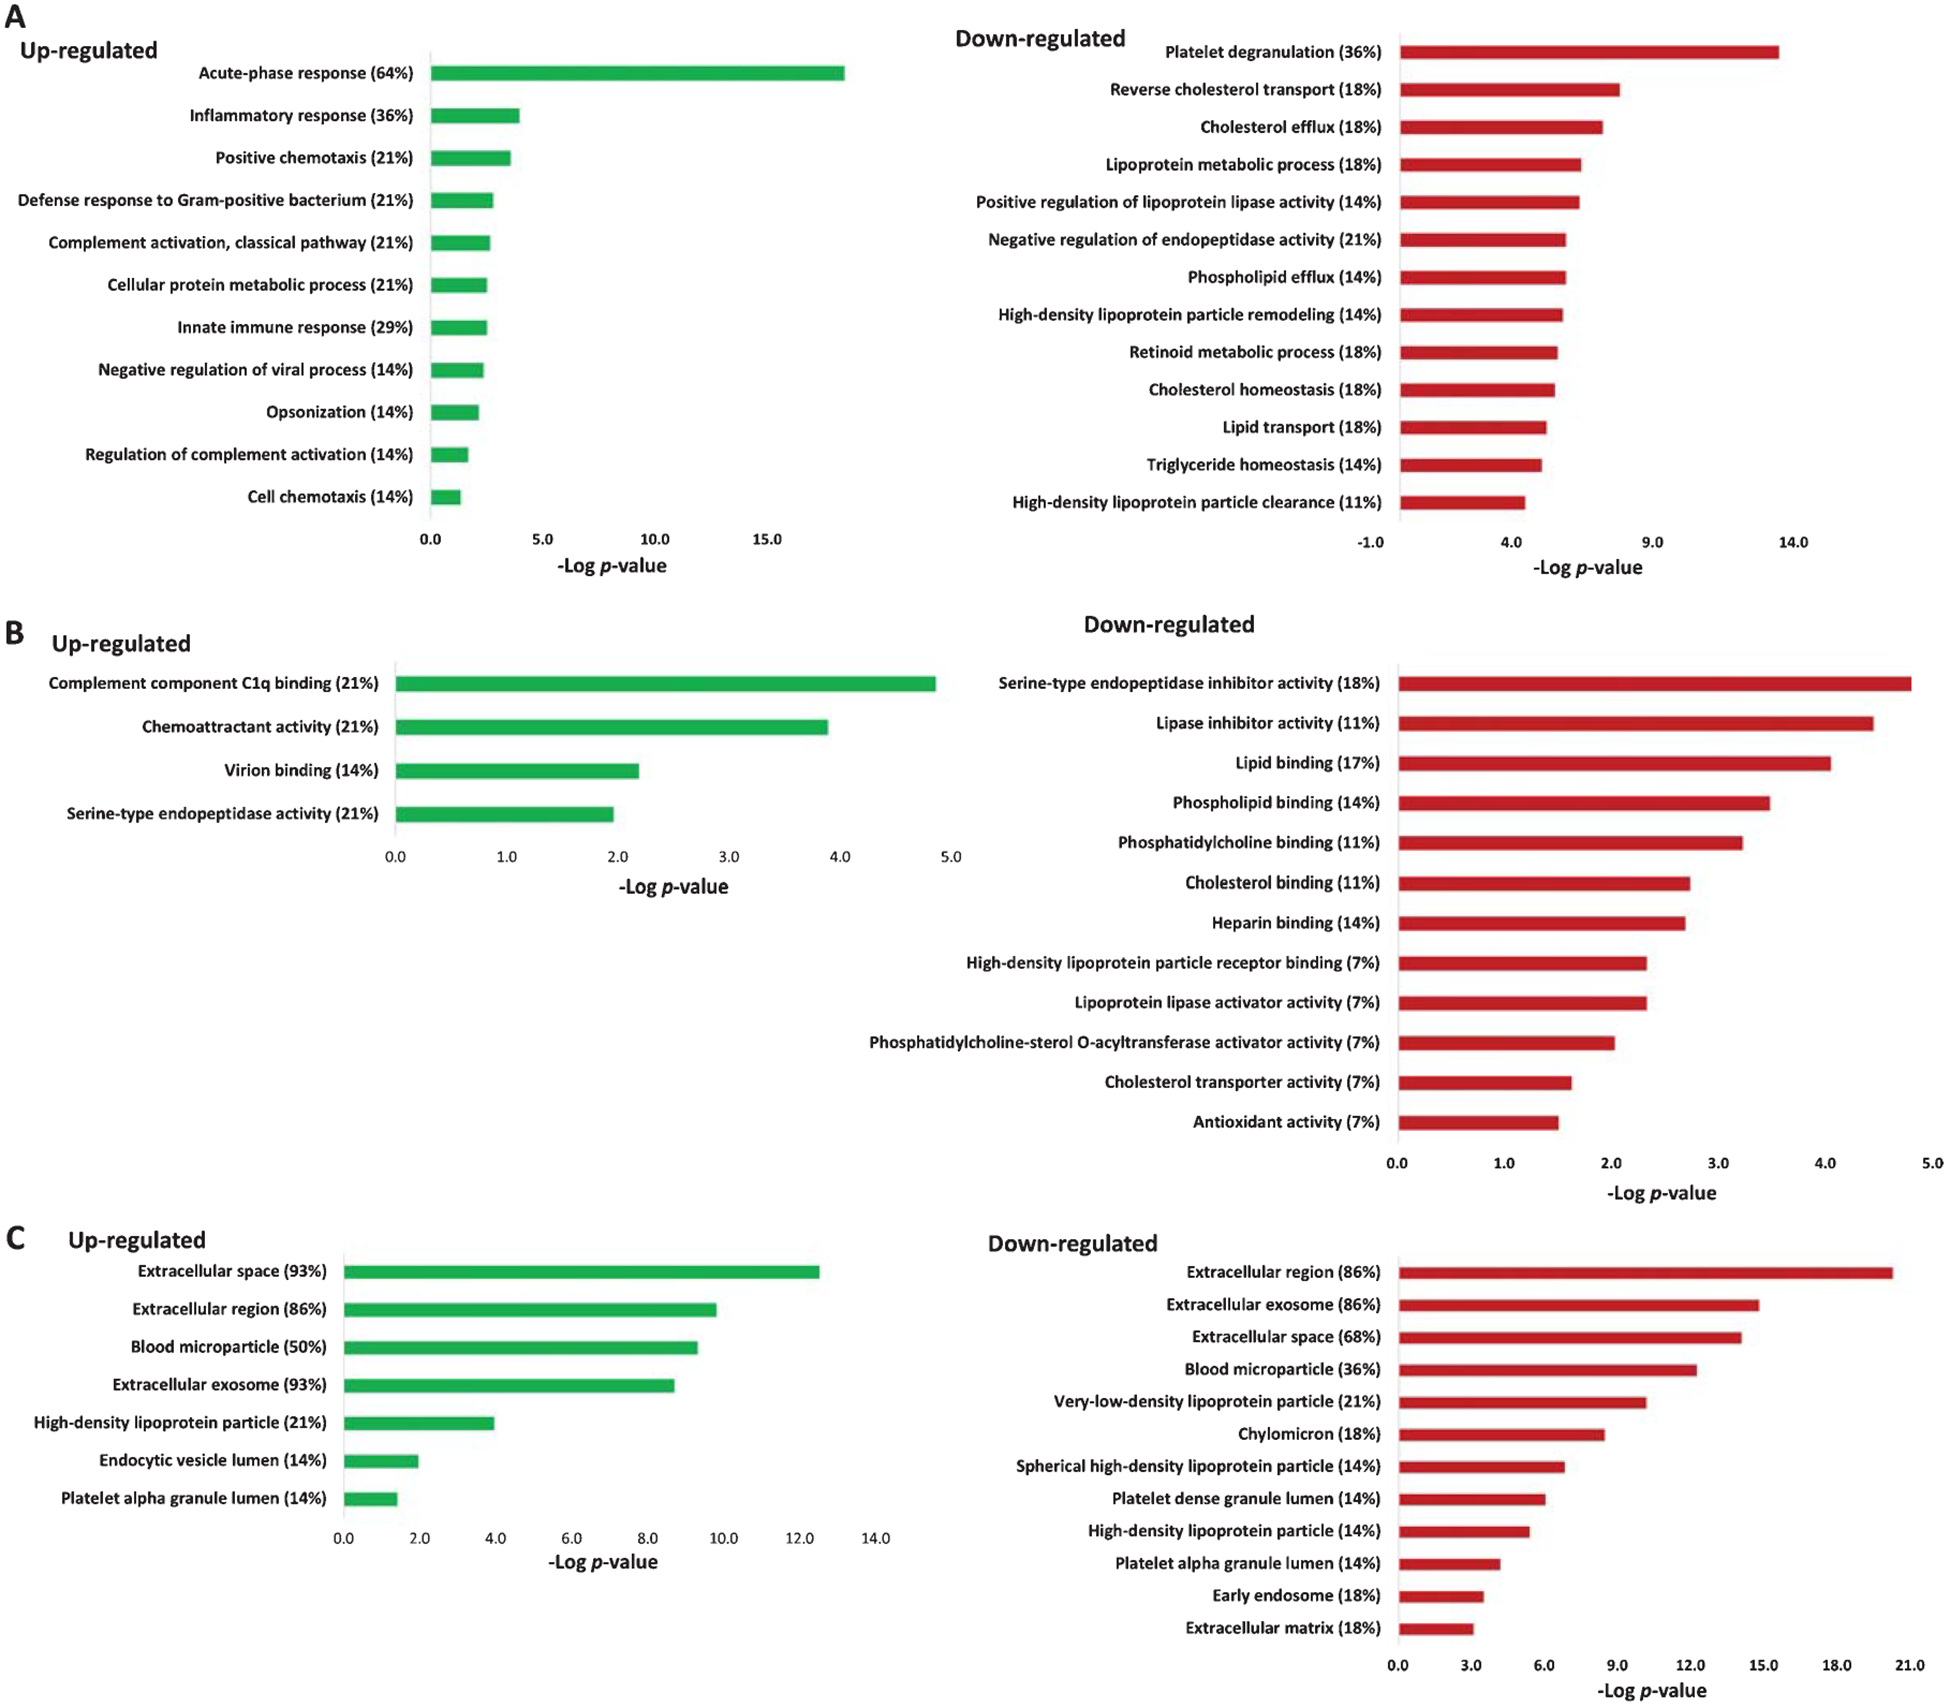
Fig. 2.

Gene ontology enrichment analysis of up- and downregulated plasma proteins in three categories: A) biological processes, B) molecular function, and C) cellular components. The percentages indicate the enriched proteins among all up- or downregulated proteins. The enrichment analysis was performed using DAVID.
