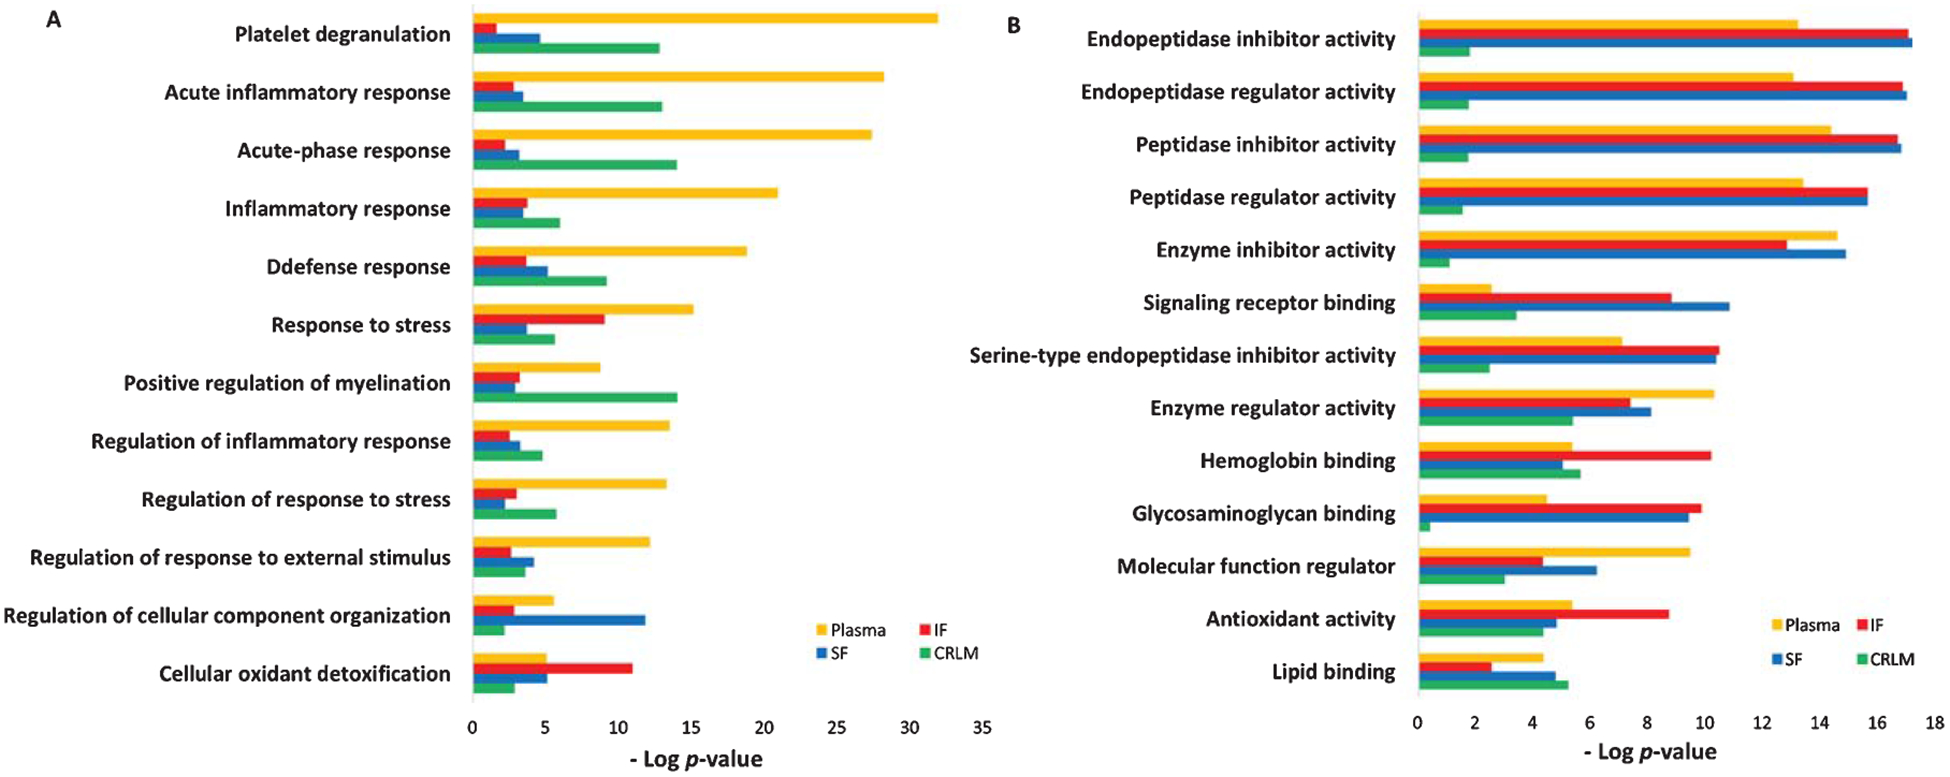
Fig. 5.

Comparison of GO functional enrichment analysis between up/downregulated plasma proteins from 18 AD patients and those from three brain regions (SF, IF, and CRLM) of 5 AD patients (p < 0.05). A) GO process. B) GO molecular function (SF, superior frontal cortex; IF, inferior frontal cortex; CRLM, cerebellum).
