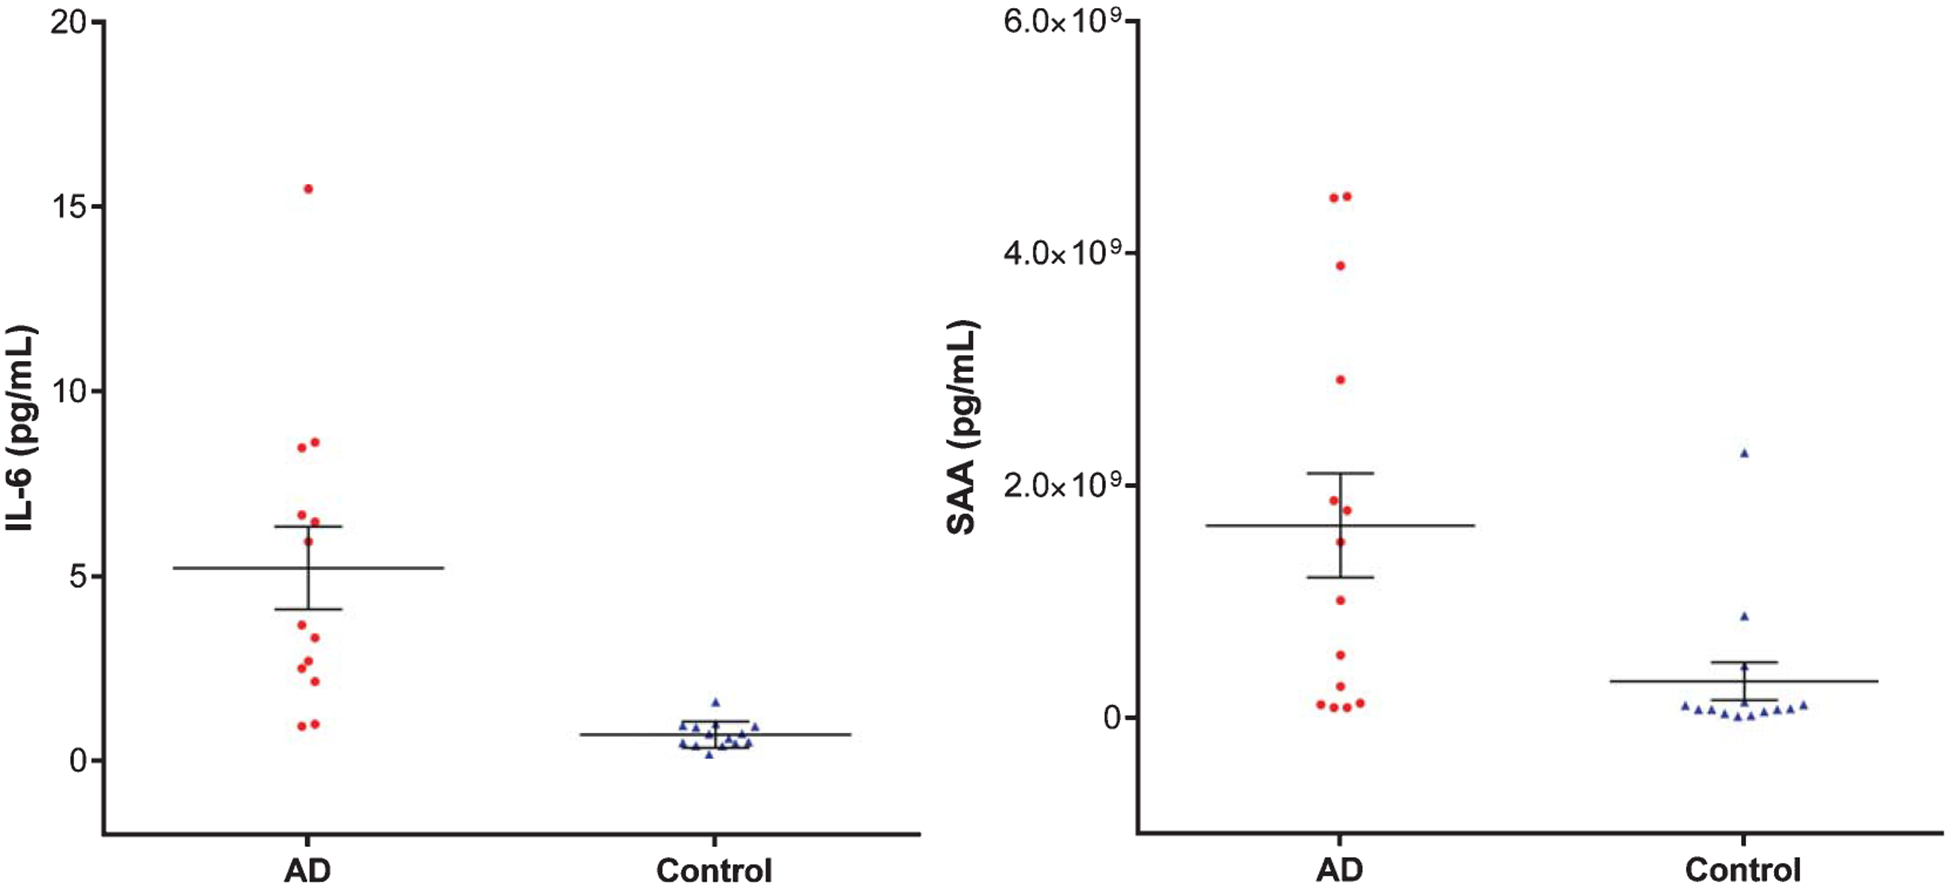
Fig. 7.

ELISA-based quantification of IL-6 and SAA in plasma from AD and control subjects. The standard error of means (short lines) and means (long middle line) are illustrated for each group. The differences between AD and control subjects are statistically significant (p < 0.05).
