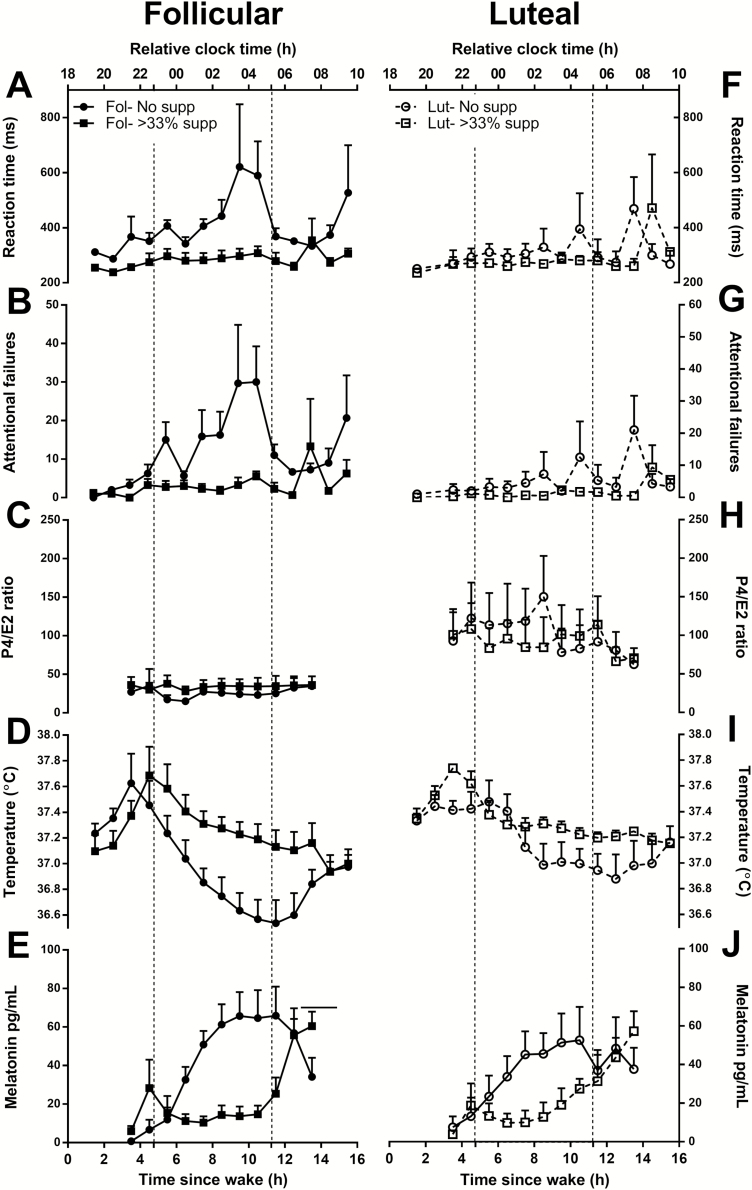
Figure 4.
The mean ± SEM of mean reaction time (A, F) and attentional failures (B, G) on the aPVT, the P4/E2 ratio (C, H), core body temperature (D, I), and melatonin (E, J) for women in the follicular (left panel) and luteal phases (right panel) who showed suppression (≥33% melatonin suppression; squares) versus no suppression (<33% suppression; circles) during the 6.5 h light exposure. Corresponding clock times are reported relative to scheduled wake. Time = 0 relative to scheduled wake was defined as 0700 h based on the group mean (mean ± SD: 0704 ± 0108 h) for illustrative purposes. The dotted lines mark the start and the end of the light exposure. Unadjusted data are plotted.

