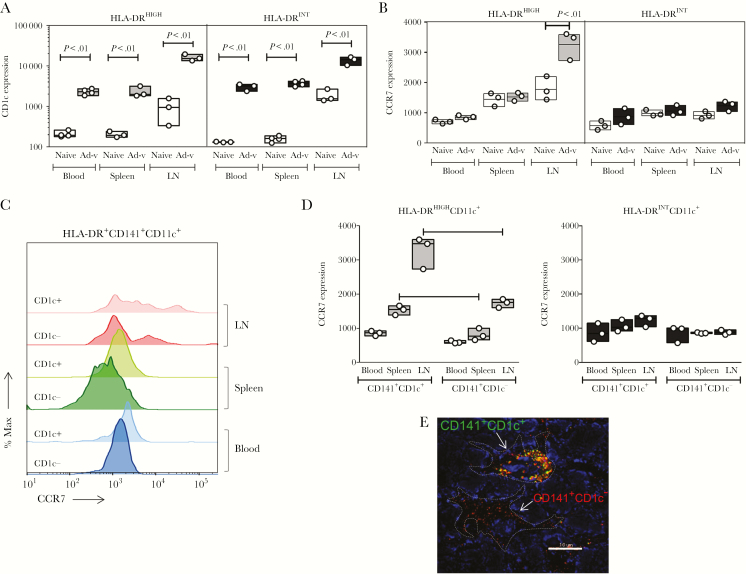
Figure 7.
Expression of CCR7 and CD1c in CD141+HLA-DRHIGHCD11c+ dendritic cells (DCs) from blood and tissues of AdPfCS/Adp24-vaccinated human immune system (HIS) mice. CD1c (A) and CCR7 (B) expression in geometric mean fluorescence intensity (gMFI) within HLA-DRHIGH and HLA-DRINTCD11c+ DCs isolated from blood, spleen, and lymph nodes (LNs) of AdPfCS/Adp24-immunized, as well as naive HIS mice. (C) CCR7 expression is displayed in histograms for CD1c− and CD1c+ subsets within CD141+HLA-DR+CD11c+ DCs isolated from blood, spleen, and LNs of AdPfCS/Adp24-immunized HIS mice. (D) CCR7 expression within HLA-DRHIGH versus HLA-DRINTCD141+CD11c+ DCs with or without CD1c expression. (E) Coexpression of CD141 and CD1c in LN from HIS mice 24 hours after immunization with AdPfCS/Adp24 was assessed by confocal fluorescence microscopy. Lymph nodes were isolated and stained with antihuman CD141 and antihuman CD1c antibodies, and after counterstaining the nuclei with Hoechst 33342, the images were collected using a LSM510 confocal microscope (original magnification, ×100). Dotted lines denote DCs, which are either coexpressing CD141 and CD1c or displaying CD141+CD1c− phenotype. Tissue samples, especially LN, were pooled from 7 individual HIS mice that were given injections of human hematopoietic stem cells (HSCs) from the same donor. The results are displayed by floating bars expressing minimum, maximum, and mean values overlaid by scatter graphs, which indicate the sample size (n = 3 pools). Statistical analyses were performed using analysis of variance followed by Dunnett’s test, and differences were considered when P < .05. The vaccination experiments were repeated twice and data illustrate 1 representative experiment.

