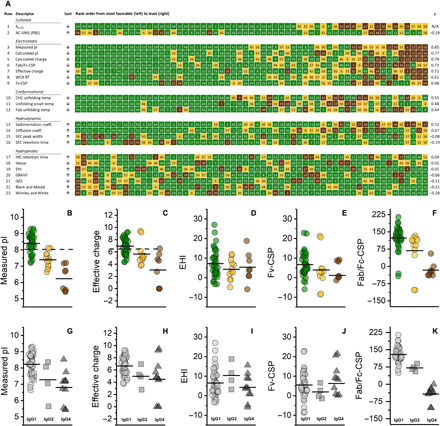
Fig. 3. Electrostatic repulsion dominates colloidal interactions in dilute solution.

(A) Twenty-three measured and calculated molecular descriptors arranged in order of decreasing favorable value from left to right. Individual mAbs are identified by the numbers in each box and color-coded according to their solution behavior category: inviscid and clear (green), viscous (tan), or opalescent (brown). The Spearman’s rank order correlation (ρ) for each descriptor with respect to kD,His (row 1) is indicated in the rightmost column. (B) to (F) indicate selected molecular descriptors of mAbs [color-coded as in (A)]: (B) measured pI, (C) measured charge, (D) EHI, (E) Fv-CSP, and (F) Fab/Fc-CSP. (G) to (K) indicate the same descriptors organized by subclass as follows: IgG1 (circles), IgG2 (squares), and IgG4 (triangles). Selection thresholds for measured pI and charge (B and C) are indicated with black dashed lines. Solid horizontal lines in (B) to (K) represent mean values of a descriptor in a given category.
