
Figure 8.
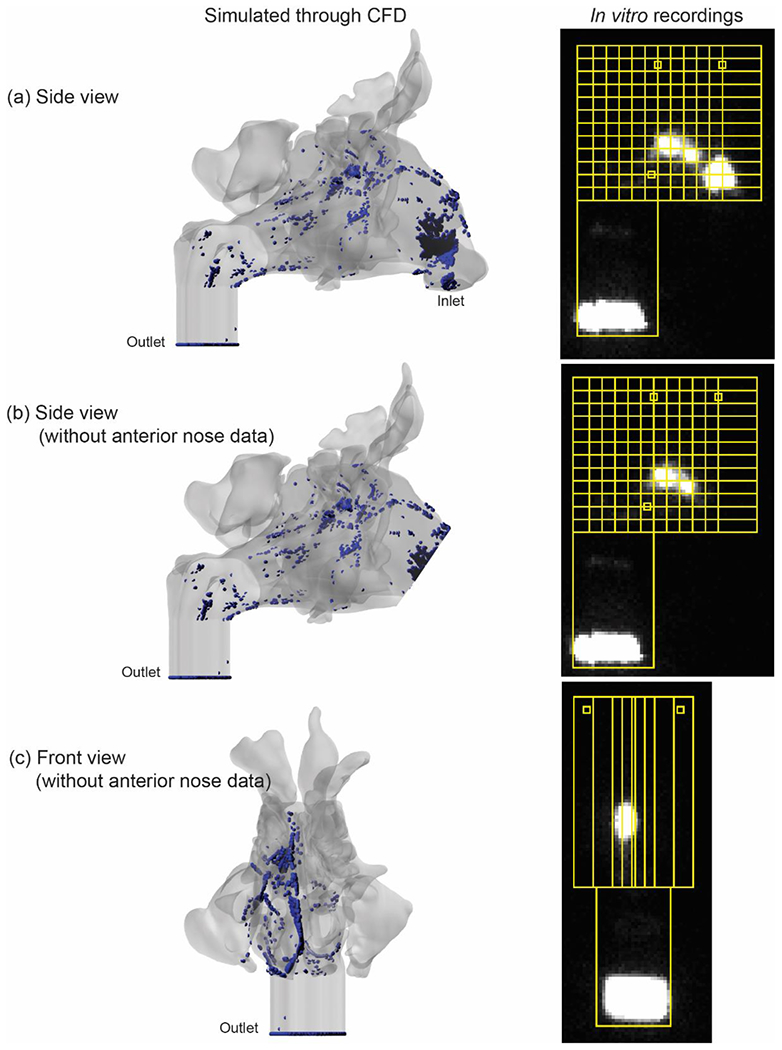
Validation of CFD Nebulized Particle Model. Left: Visualization of CFD nebulized particle deposition (blue = deposited particles). Right: Gamma scintigraphy-based nebulized particle deposition (bright signal = deposited particles). “Anterior nose” region is excluded in panels B and C to remove the high gamma scintigraphy anterior nose signal for better visualization of deposition in the regions of interest more posteriorly.