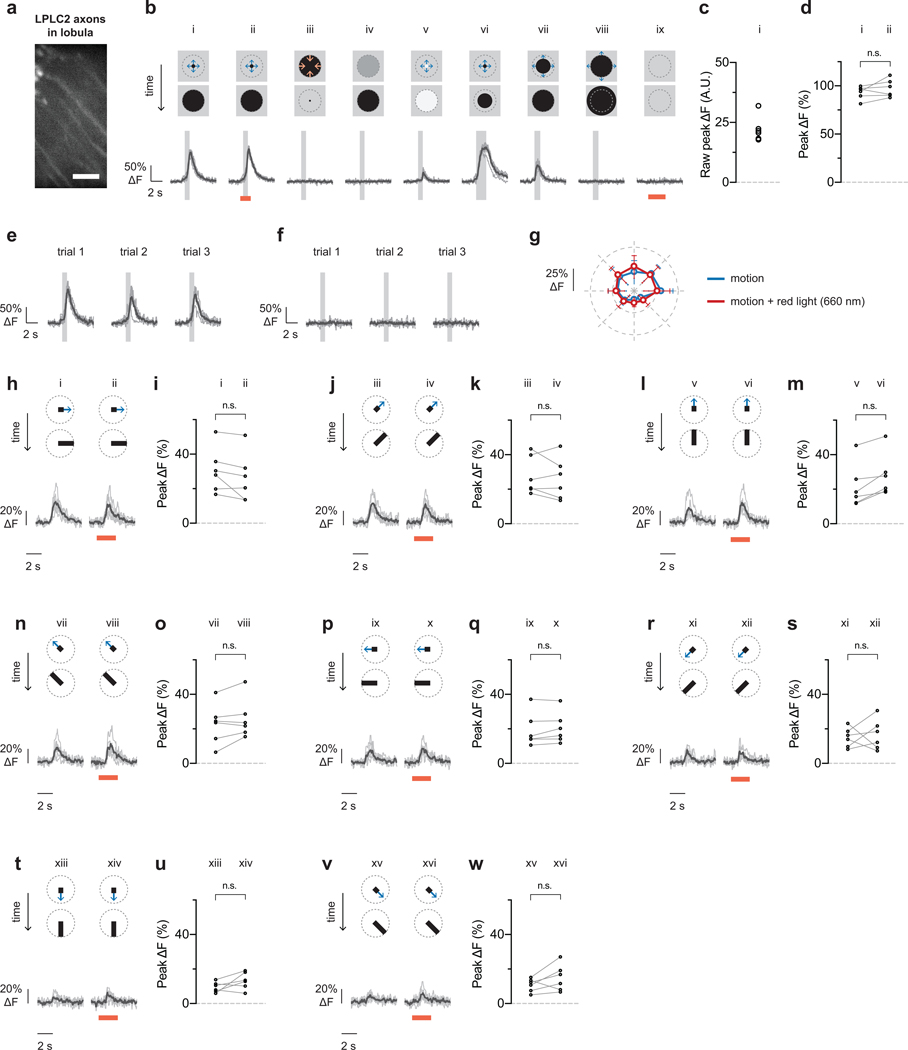
Extended data figure 8: Controls for LPi4-3 optogenetic modulation experiments.
Single-cell visual responses from control flies with an LPLC2-driven GCaMP6f and an enhancerless GAL4-driven CsChrimson (n = 6 neurons, N = 6 flies). Calcium traces shown for individual neurons (grey) and population average (black) throughout. Each neuron’s response is normalized to its dark looming response (bi, 5° to 60° expansion at r/v = 40 ms) throughout the figure. Overlaid light grey bar indicates motion stimulus period. Red bar indicates red light stimulation period. a, Representative calcium image from LPLC2 axons in the lobula. Scale bar, 10 μm. b-f, Visual responses to receptive-field-centered stimuli. b, Stimulus diagram (top) and calcium response trace (bottom) for constant approach velocity looming (i-v, r/v = 40 ms) and constant edge expansion (vi-viii, 10°/s edge speed). c, Raw peak calcium responses to stimulus used for normalization (bi) are shown for individual neurons. d, Effect of red light on looming responses (P = 0.2237, paired t-test, two-sided). e, Individual trial responses to stimulus (bi). f, Individual trial responses to stimulus (biii). g-w, Comparison of visual responses with or without red light (660 nm) stimulation. Directional tuning with a 10° bar expanding outward at 20°/s along the indicated directions. RM-ANOVA with Bonferroni’s post hoc test, * P < 0.05. g, Polar plot summary (means ± 95% CI). Statistically significant data points (P < 0.05) are drawn as closed circles, insignificant data points are drawn as open circles. h-w, Detailed single cell traces and comparisons. Individual neurons depicted as circles in statistical comparisons.

