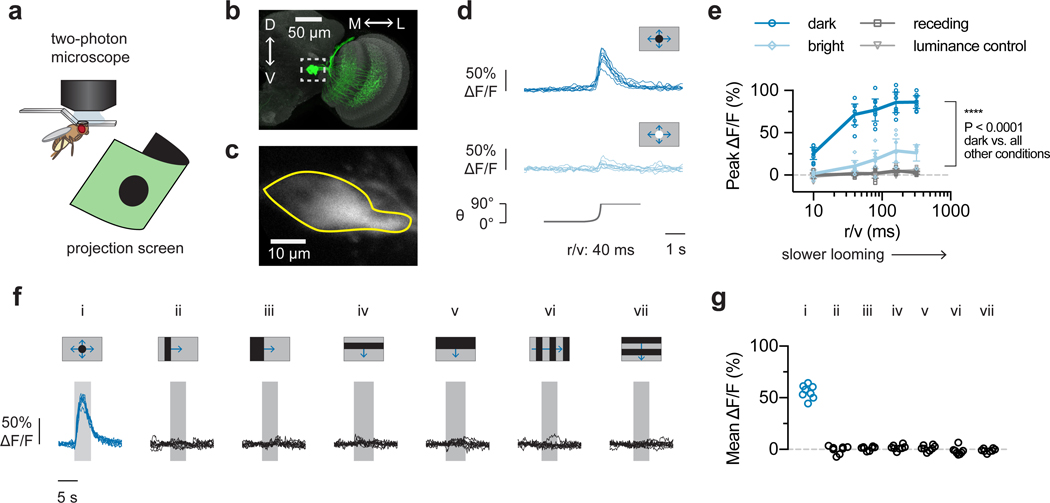
Figure 2: LPLC2 population selectively encodes looming stimuli.
a, Imaging setup. b, LPLC2 neurons (green) on reference neuropil (grey); dashed box indicates axon terminal region. c, LPLC2 axon terminal calcium fluorescence; Region of interest (ROI) outlined in yellow. d-e, LPLC2 population looming responses. N = 8 flies. d, Individual fly calcium transients for dark (top) and bright (middle) looming (bottom, disk diameter). Calcium traces shown throughout paper are average of 3 trials. e, Peak responses to a range of looming speeds (mean ± 95% CI, overlay: individual flies). RM-ANOVA, Tukey’s post hoc test. f-g, Individual responses (N = 8 flies) to constant edge velocity looming (i, blue, 10°/s edge speed) and wide-field motion stimuli (ii-vii, black, 20°/s edge speed). Mean responses (g) measured during stimulus presentation (f, grey regions).

