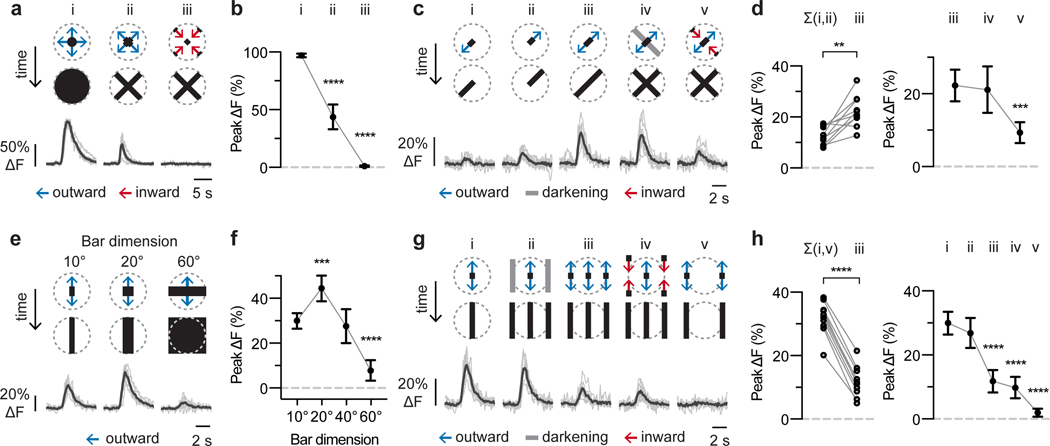
Figure 4: Contributions of excitatory and inhibitory inputs to LPLC2 visual responses.
Decomposition of motion along (a-d) or between (e-h) cardinal axes for individual LPLC2 cells. Stimulus diagram above calcium traces shows motion within receptive field (dashed circle). Bar stimuli have 10° fixed width and 20°/s edge speed unless otherwise specified. Traces are population average (black) and individual neurons (grey). Statistics analyzed using RM-ANOVA with specified post hoc test throughout. Population plots are mean and 95% CI. n = 10 neurons, N = 7 flies. * P < 0.05, ** P < 0.01, *** P < 0.001, **** P < 0.0001. a-b, Responses to disk expansion (i, 10°/s) and outward (ii) or inward (iii) cross motion. Dunnett’s post hoc test, reference i. c-d, Responses to outward motion along a cardinal axis (i-iii) and the effects of luminance (iv) or inward motion (v) on the orthogonal axis. d, left, Comparison of linear sum of individual responses (i,ii) to the measured combined response (iii). Circles, individual neurons. Bonferroni’s post hoc test. d, right, Effects of orthogonal axis darkening and inward motion. Dunnett’s post hoc test, reference iii. e-f, Effects of bar width on expansion between cardinal axes. Dunnett’s post hoc test, reference 10° bar response. g-h, Decomposing responses to motion between cardinal axes. h, left, Comparison of linear sum of individual responses to motion at receptive field center (i) and edges (v) to the measured response during expansion in both areas (iii). Circles, individual neurons. Bonferroni’s post hoc test. h, right, Comparison of motion at the edge versus center of the receptive field. Dunnett’s post hoc test, reference i.

