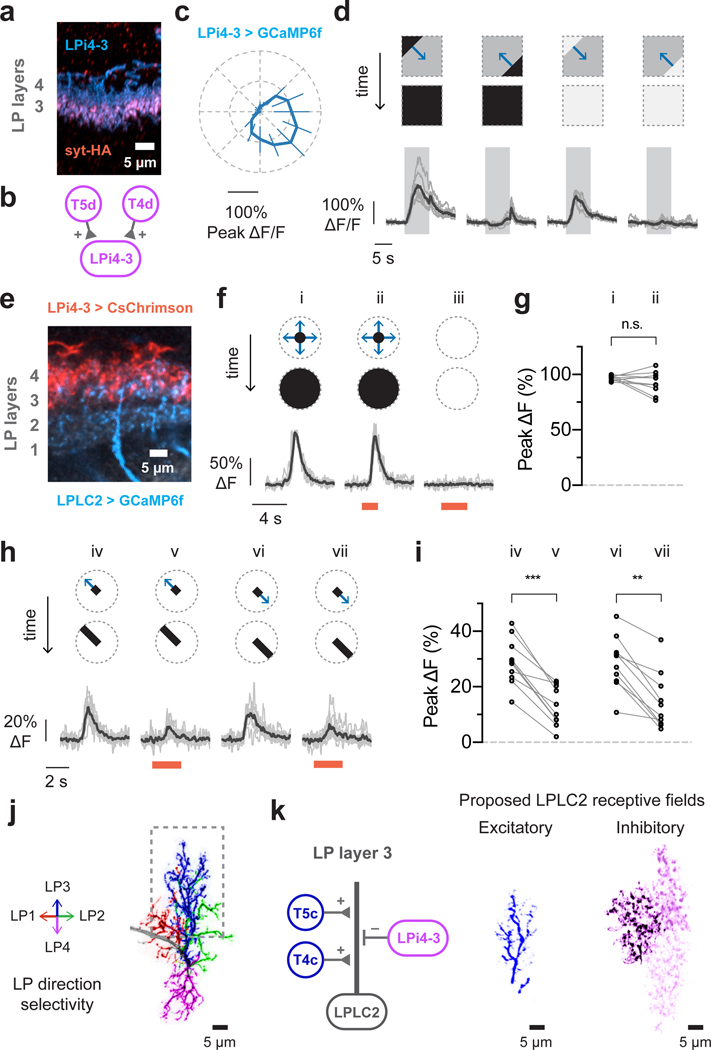
Figure 5: Directionally selective inhibitory inputs to LPLC2 further sculpt looming selectivity.
a-d, Lobula plate intrinsic interneuron LPi4-3 anatomy and direction selectivity. Traces are population average (black) and individual flies (grey). N = 7 flies. a, LPi4-3 neurons (cyan) with synaptogamin marker (red). b, Model of LPi4-3 inputs. c, Directional tuning response to moving square-wave gratings. d, Dark or bright edge motion along preferred and null directions. e-i, Effect of LPi4-3 activation on LPLC2. Stimulus diagram above calcium traces shows motion within receptive field (dashed circle). Traces are population average (black) and individual neurons (grey; circle in statistic plots). Red light stimulation is indicated as red bar. n = 10 neurons, N = 7 flies. e, Lobula plate view of LPLC2 (cyan) and LPi4-3 (red). f-g, Looming alone (i, r/v 40 ms) or with red light (ii), and red light stimulation alone (iii). g, Individual neuron responses. P = 0.209, paired t-test (two-sided). h-i, Red-light activation effects on responses to bar stimuli (10° width, 20°/s edge speed). RM-ANOVA with Bonferroni’s post hoc test. ** P < 0.01, *** P < 0.001. j, Single LPLC2 neuron with dendritic branches colored by lobula plate layer and direction selectivity. k, Proposed input model and receptive fields for lobula plate layer 3 (dashed box in j). The inhibitory receptive field image is composed of three neighboring LPi4-3 cells.

