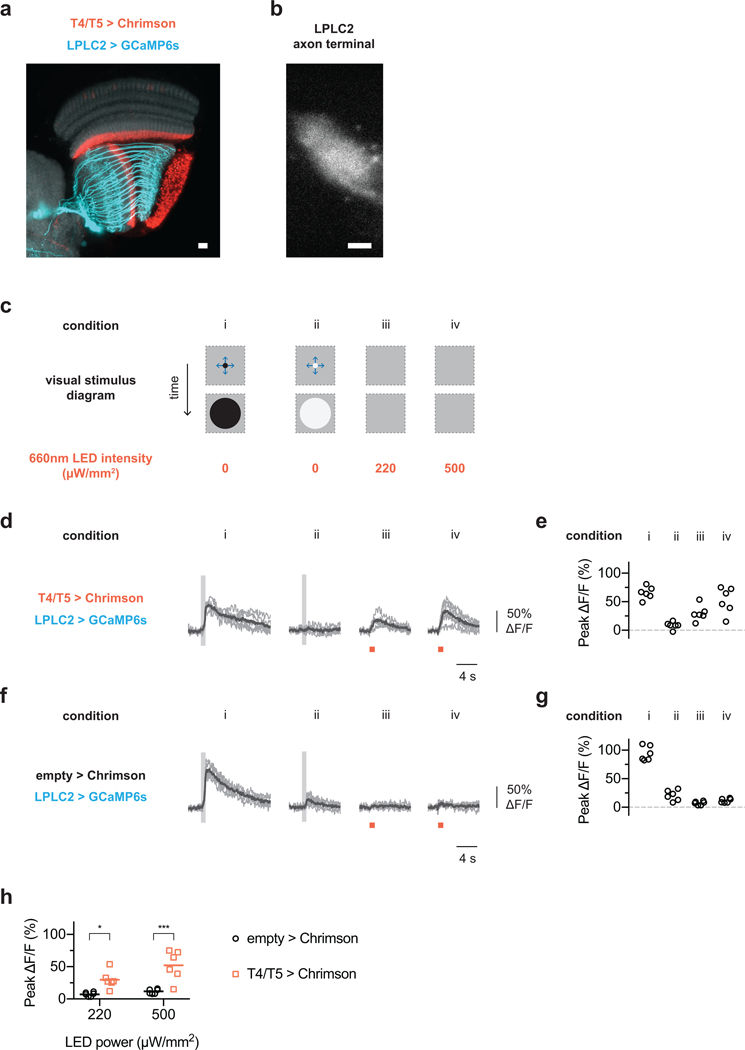
Extended data figure 2: Functional connectivity between T4/T5 and LPLC2.
a-b, Anatomy of fly transgenic used for functional connectivity experiments. Scale bar, 10 μm. a, Representative confocal image of Chrimson-expressing T4/T5 cells (red) and GCaMP6s-expressing LPLC2 cells (cyan) overlaid on neuropil marker (N-Cadherin stain, grey). b, Two-photon averaged calcium image showing LPLC2 axon terminal imaging region. c, Experimental conditions for visual stimulus and optogenetic stimulation. Conditions i and ii are looming at r/v = 40 ms, whereas conditions iii and iv have a static background intensity. d-e, Fly (N = 6) responses to visual and optogenetic stimuli. Individual fly responses are in grey and population average in black. Grey box indicates looming motion period. Red bar indicates red light stimulation period. e, Peak calcium response plotted for individual flies (circles) corresponding to measurements in (d). f-g, Enhancerless GAL4 control fly (N = 6) responses to visual and optogenetic stimuli. h, Comparison of peak calcium responses to red light between empty (f-g) and T4/T5 (d-e) GAL4 driver lines. Individual fly responses (symbols) overlaid on population mean (line). Two-way ANOVA with Bonferroni’s post hoc test. * P < 0.05, *** P < 0.001.

