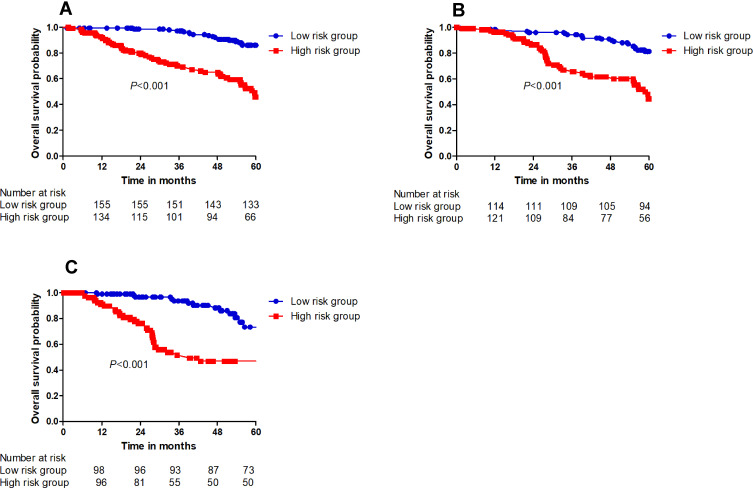
Figure 5.
The cumulative OS rate stratified by risk score of the nomogram was then used to plot Kaplan-Meier curves. (A) The cumulative OS rate in high-risk group was higher than that in low-risk group in training sets. (B) The cumulative OS rate in high-risk group was higher than that in low-risk group in internal validation sets. (C) The cumulative OS rate in high-risk group was higher than that in low-risk group in external validation sets.

