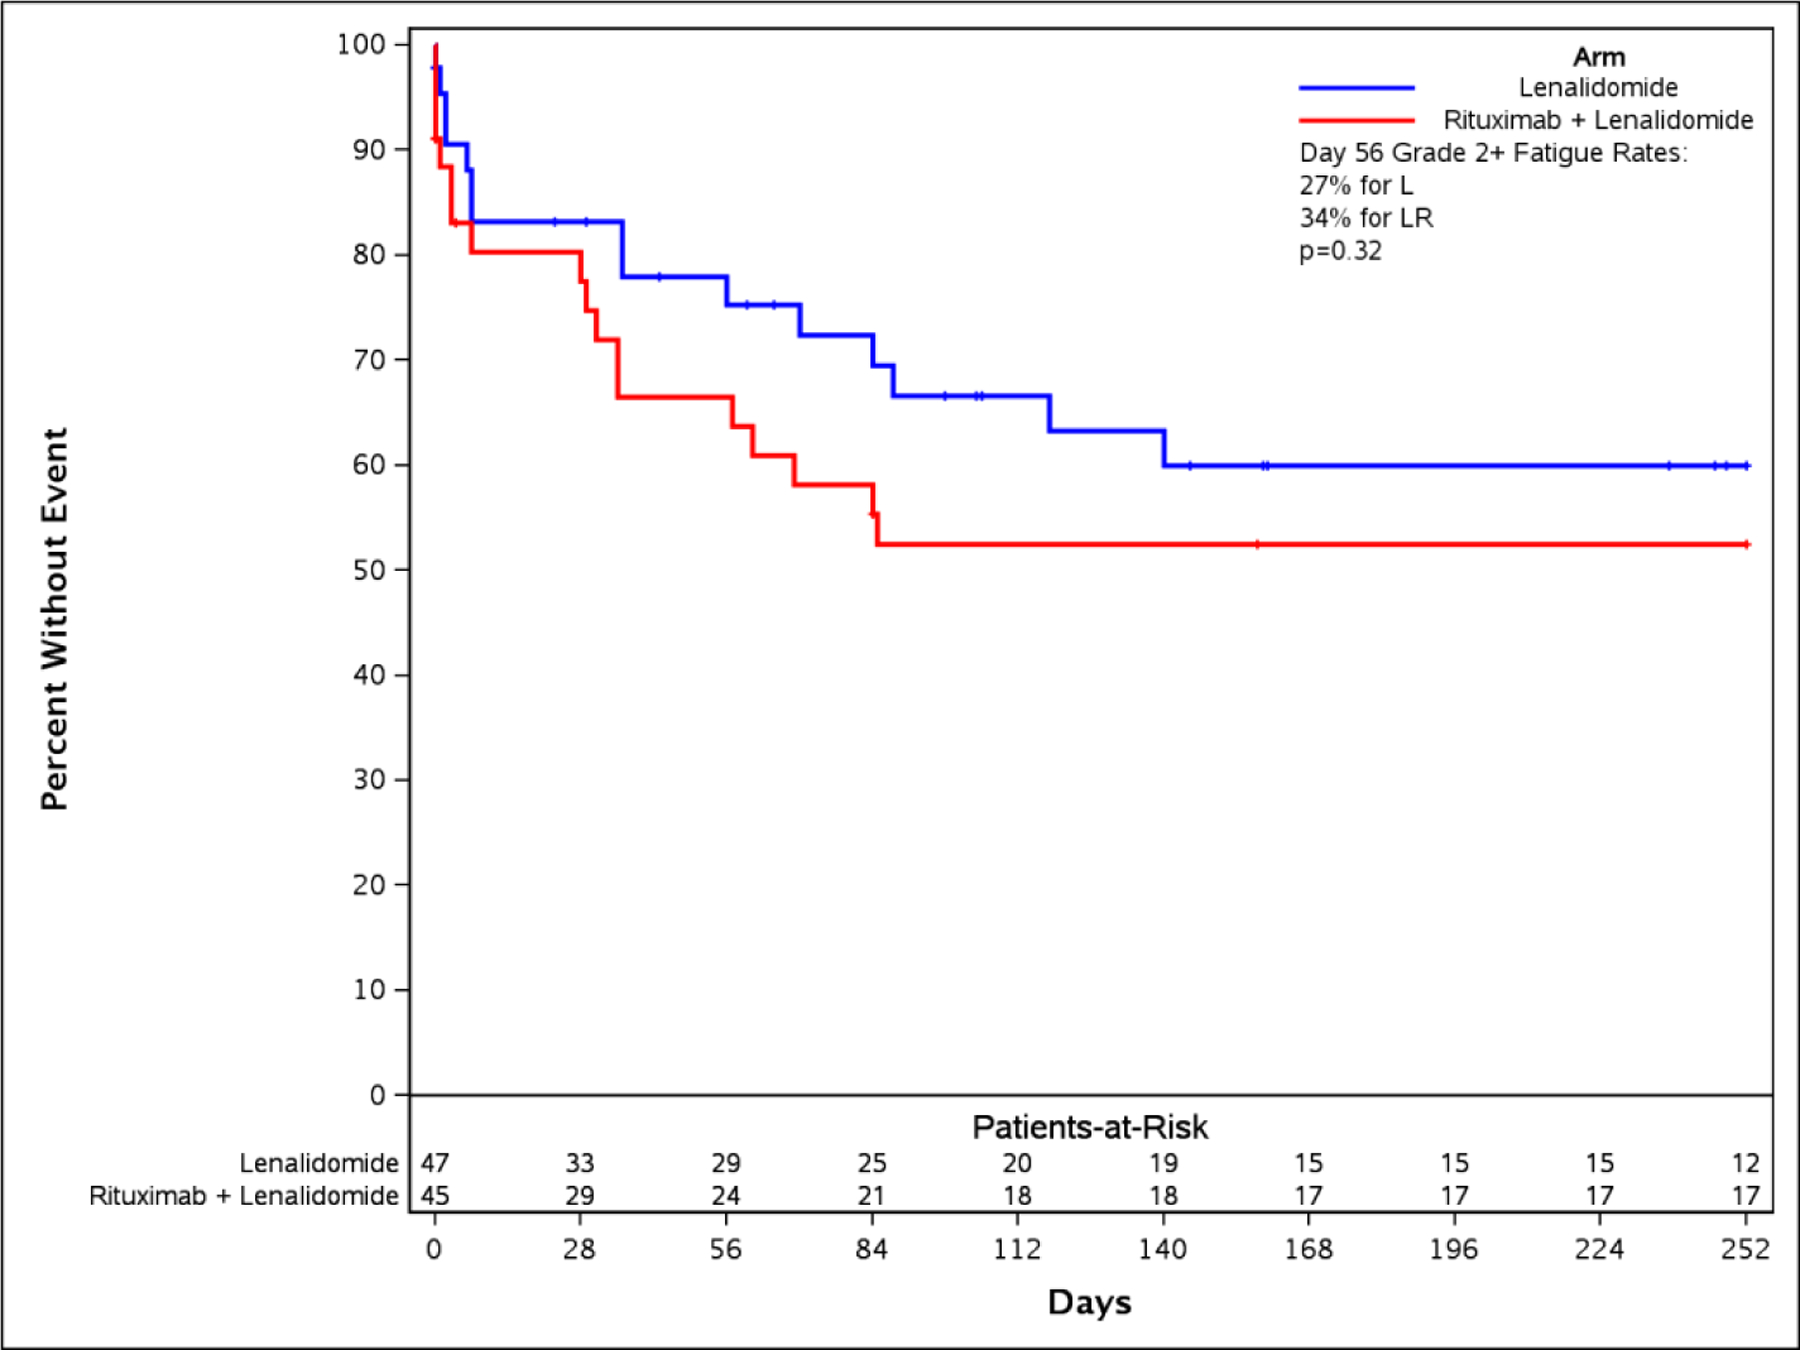
Figure 3. Time-to-AE analyses.


Panel A: The time to event bar chart depicts that first onset and worst grade of fatigue occur in under 10 days (early event). Neutropenia occurs late and worsens over time on drug. Panel B: A time-to-fatigue curve demonstrates patients on both arms had similar time to onset of grade 2+ fatigue
