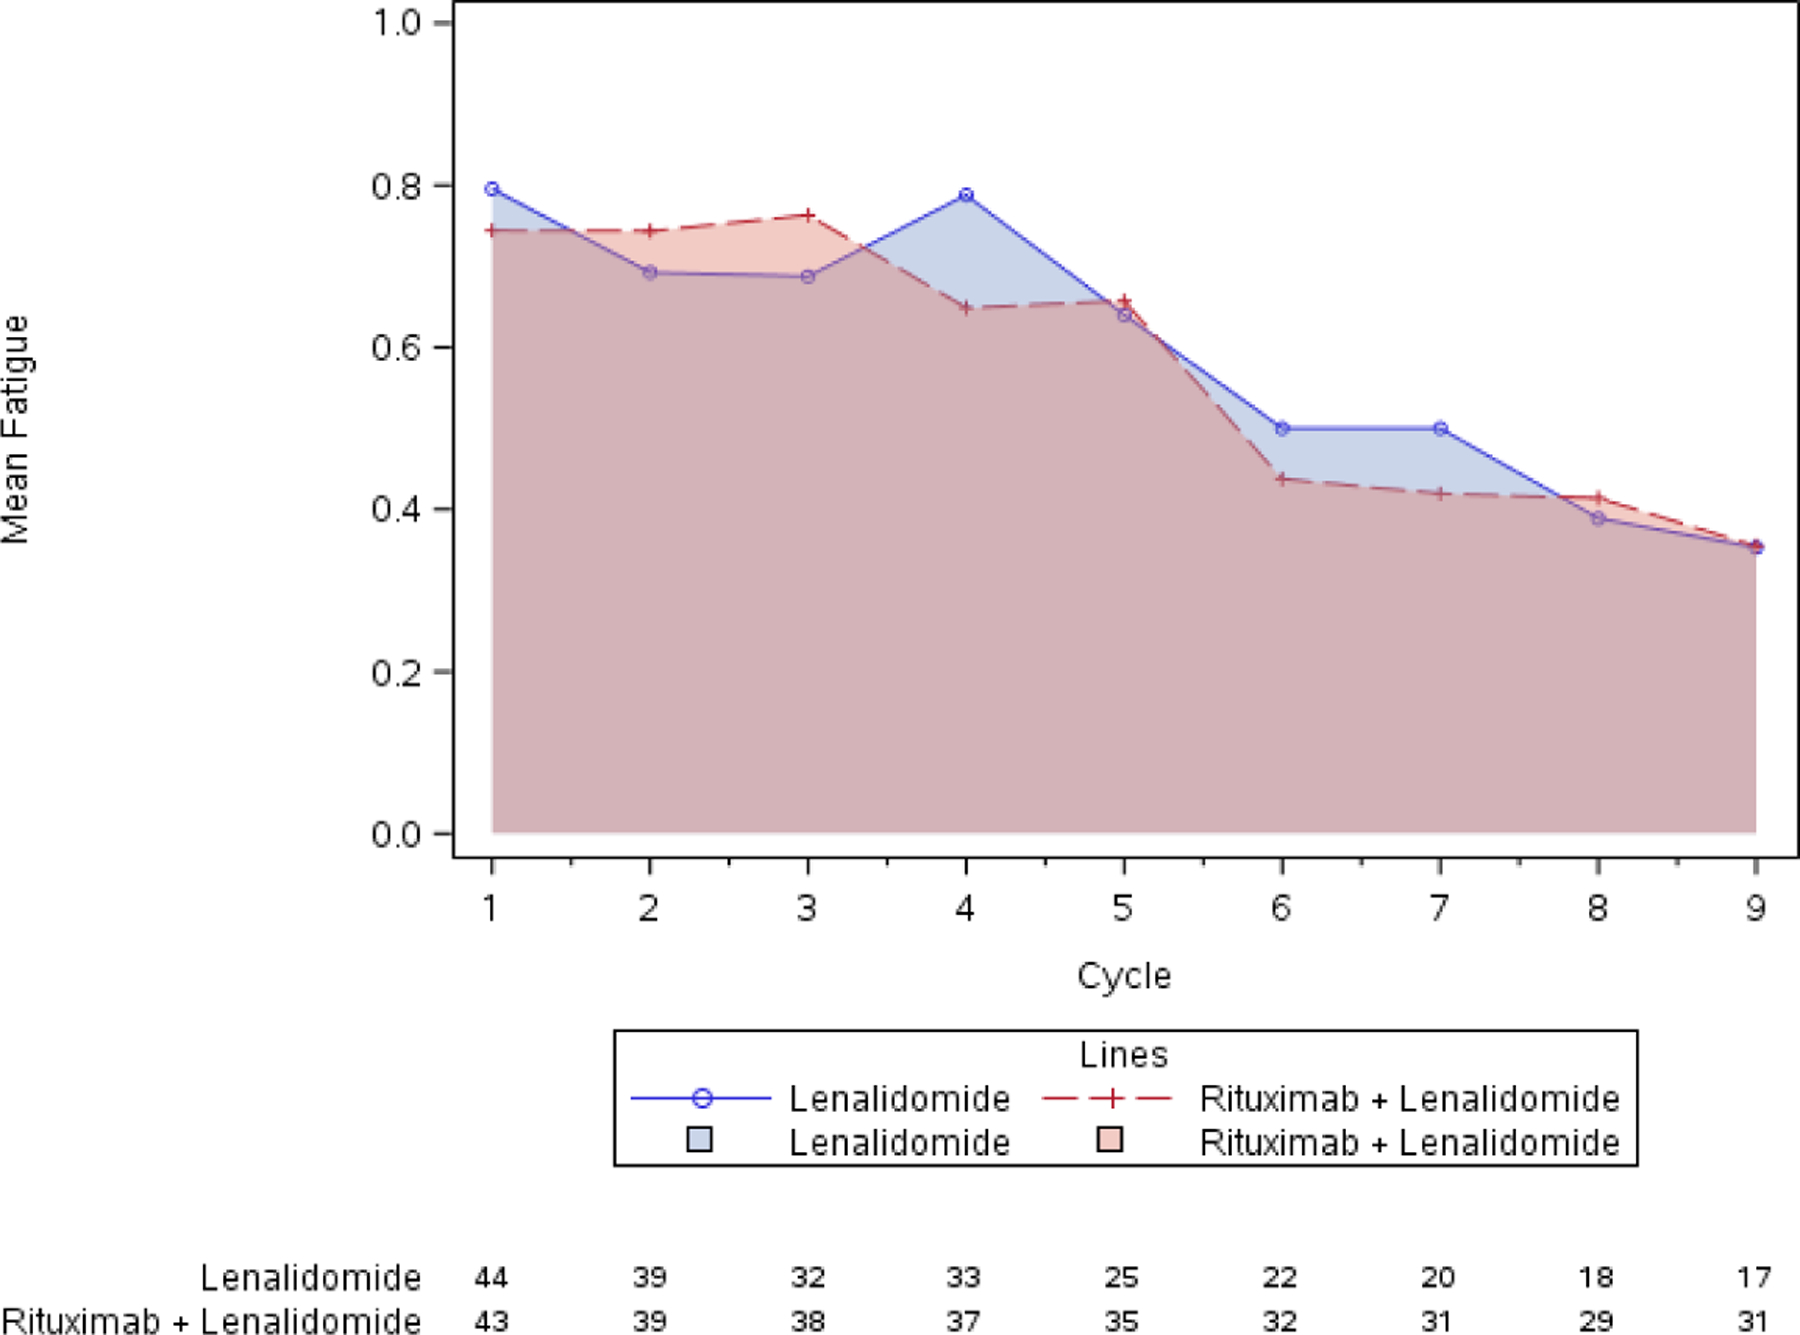
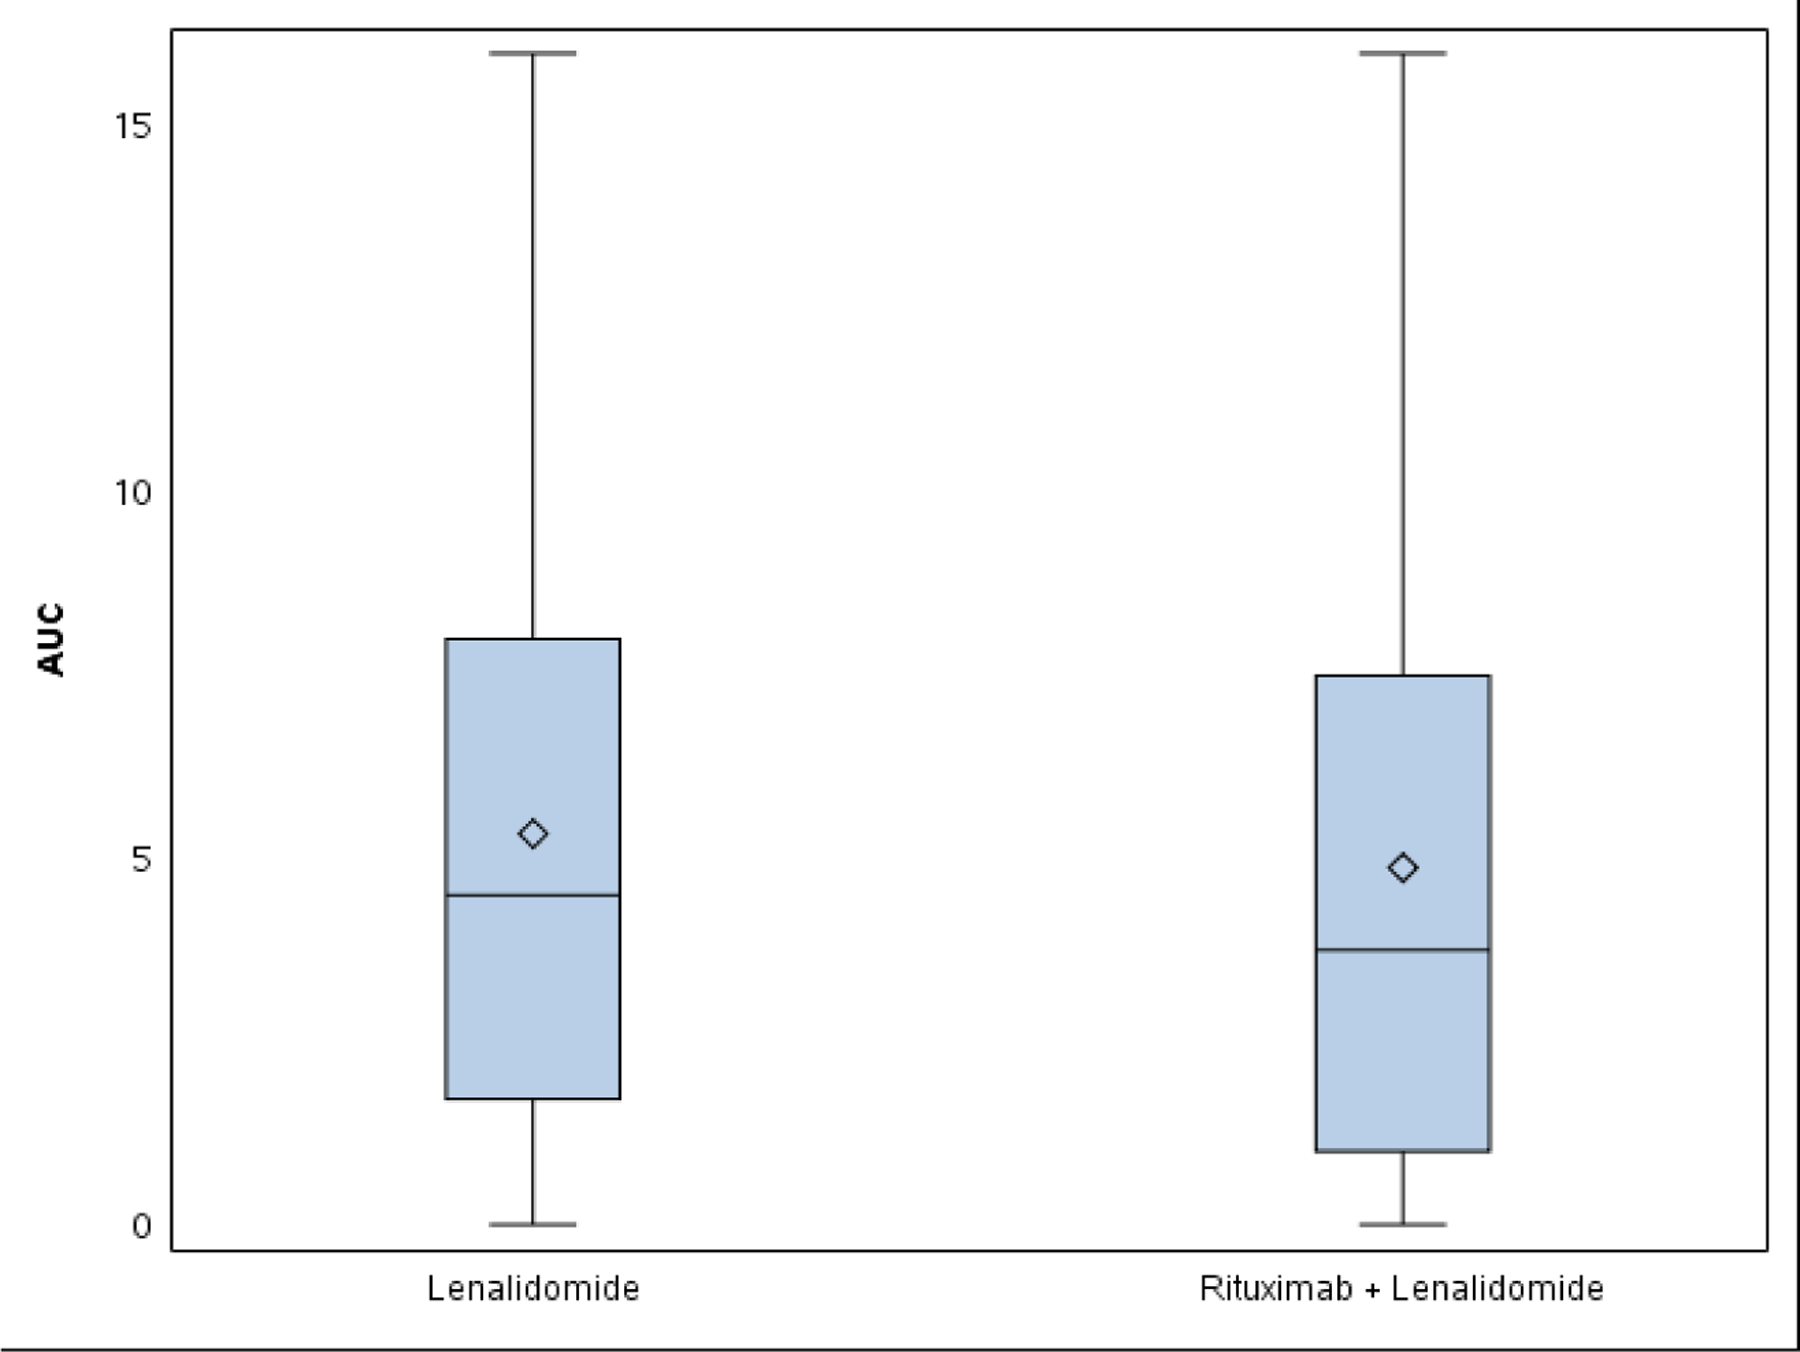
Figure 4. Capturing the burden of chronic symptomatic AEs: Alternate approaches to AUC calculation and visualization.


Panel A: Graphical visualization of group AUC for fatigue shows no clear difference between arms. AUC was 4.8 on lenalidomide (L) and 4.6 on lenalidomide plus rituximab (LR). Panel B: Mean individual AUC box-and-whisker plot. AUC was 5.3 on L and 4.9 on LR (p=0.39).
