
Figure 2.
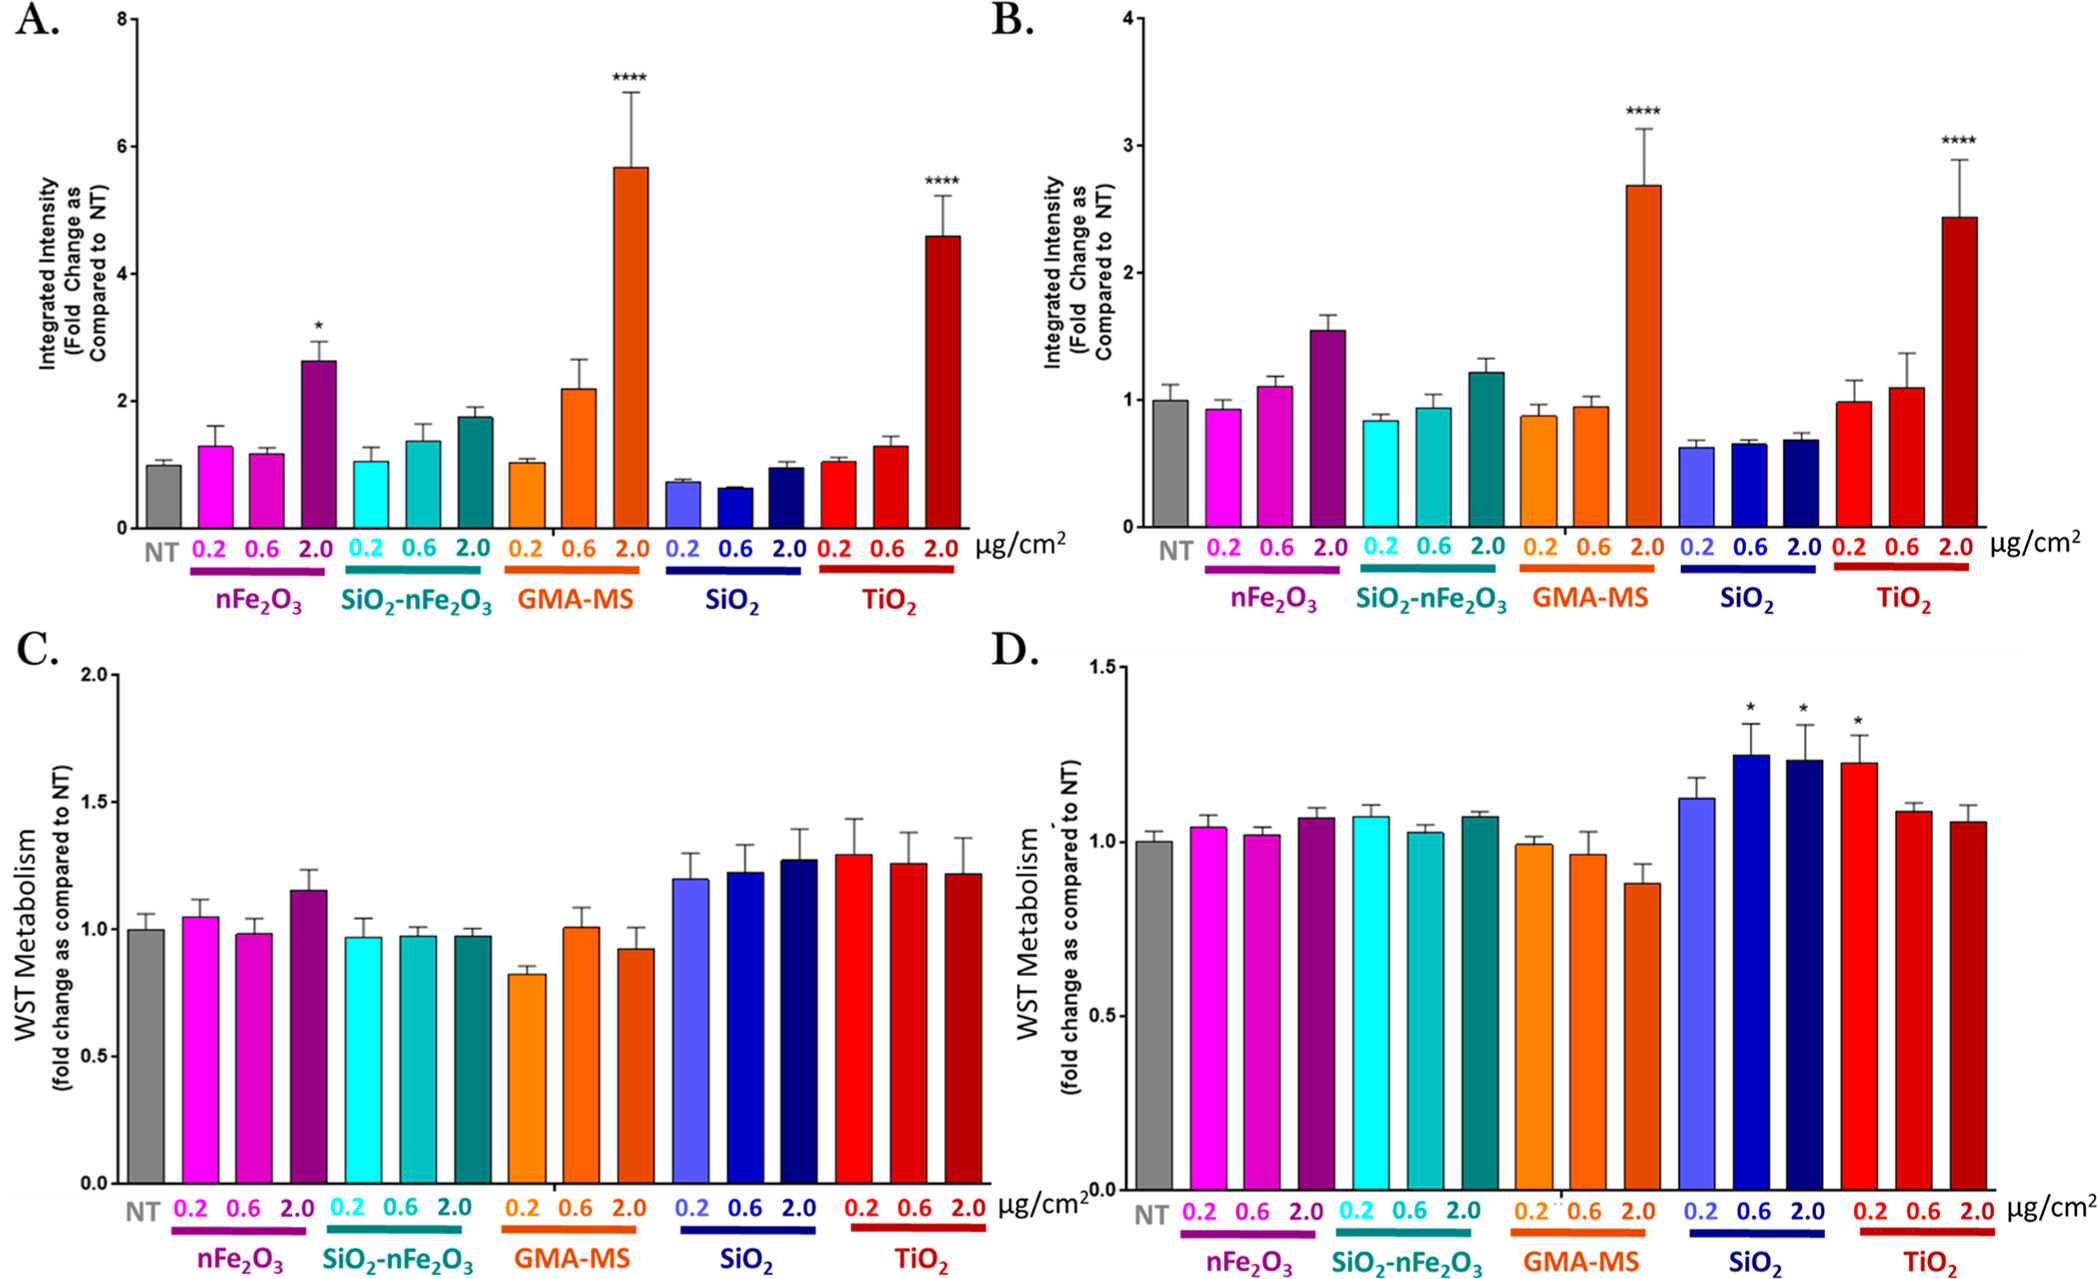
Acute particle-induced changes in ROS production (DCF assay) at (A) 18 and (B) 24 h and WST metabolism at (C) 18 and (D) 24 h postexposure. Doses refer to the administered dose. Error bars indicate the mean ± SEM (n = 3). *p < 0.05, ****p < 0.0001 from the nontreated control (NT).