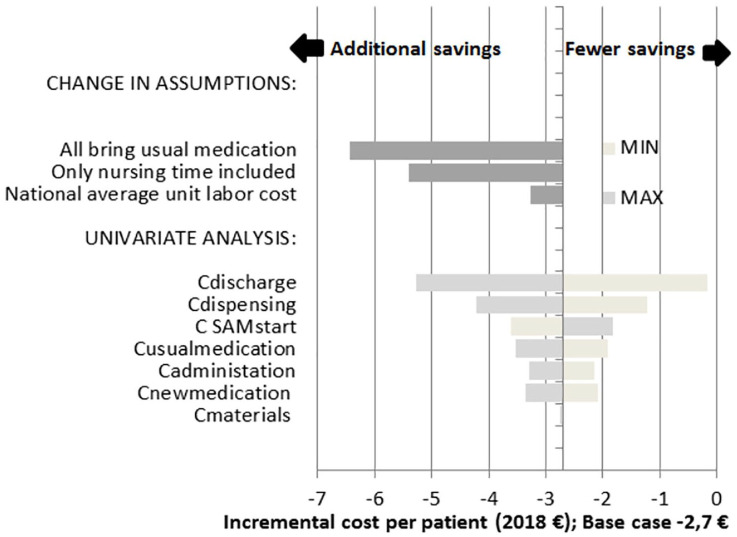
Figure 2.
Tornado-diagram of results from the sensitivity analyses.
Note: Change in assumptions: three analyses with changes in the assumptions:
(i) assuming that every SAM patient brings and uses their own medication during hospitalization;
(ii) assuming that only nursing time was relevant; and
(iii) assuming an average hourly labor cost on the national level (31).
Univariate analysis: bootstrapped CIs were used as minimum and maximum values of each cost item holding others constant.
Values to the left show additional savings when compared with the base case whereas values to the right show cases with lower savings.

