
Figure 5.
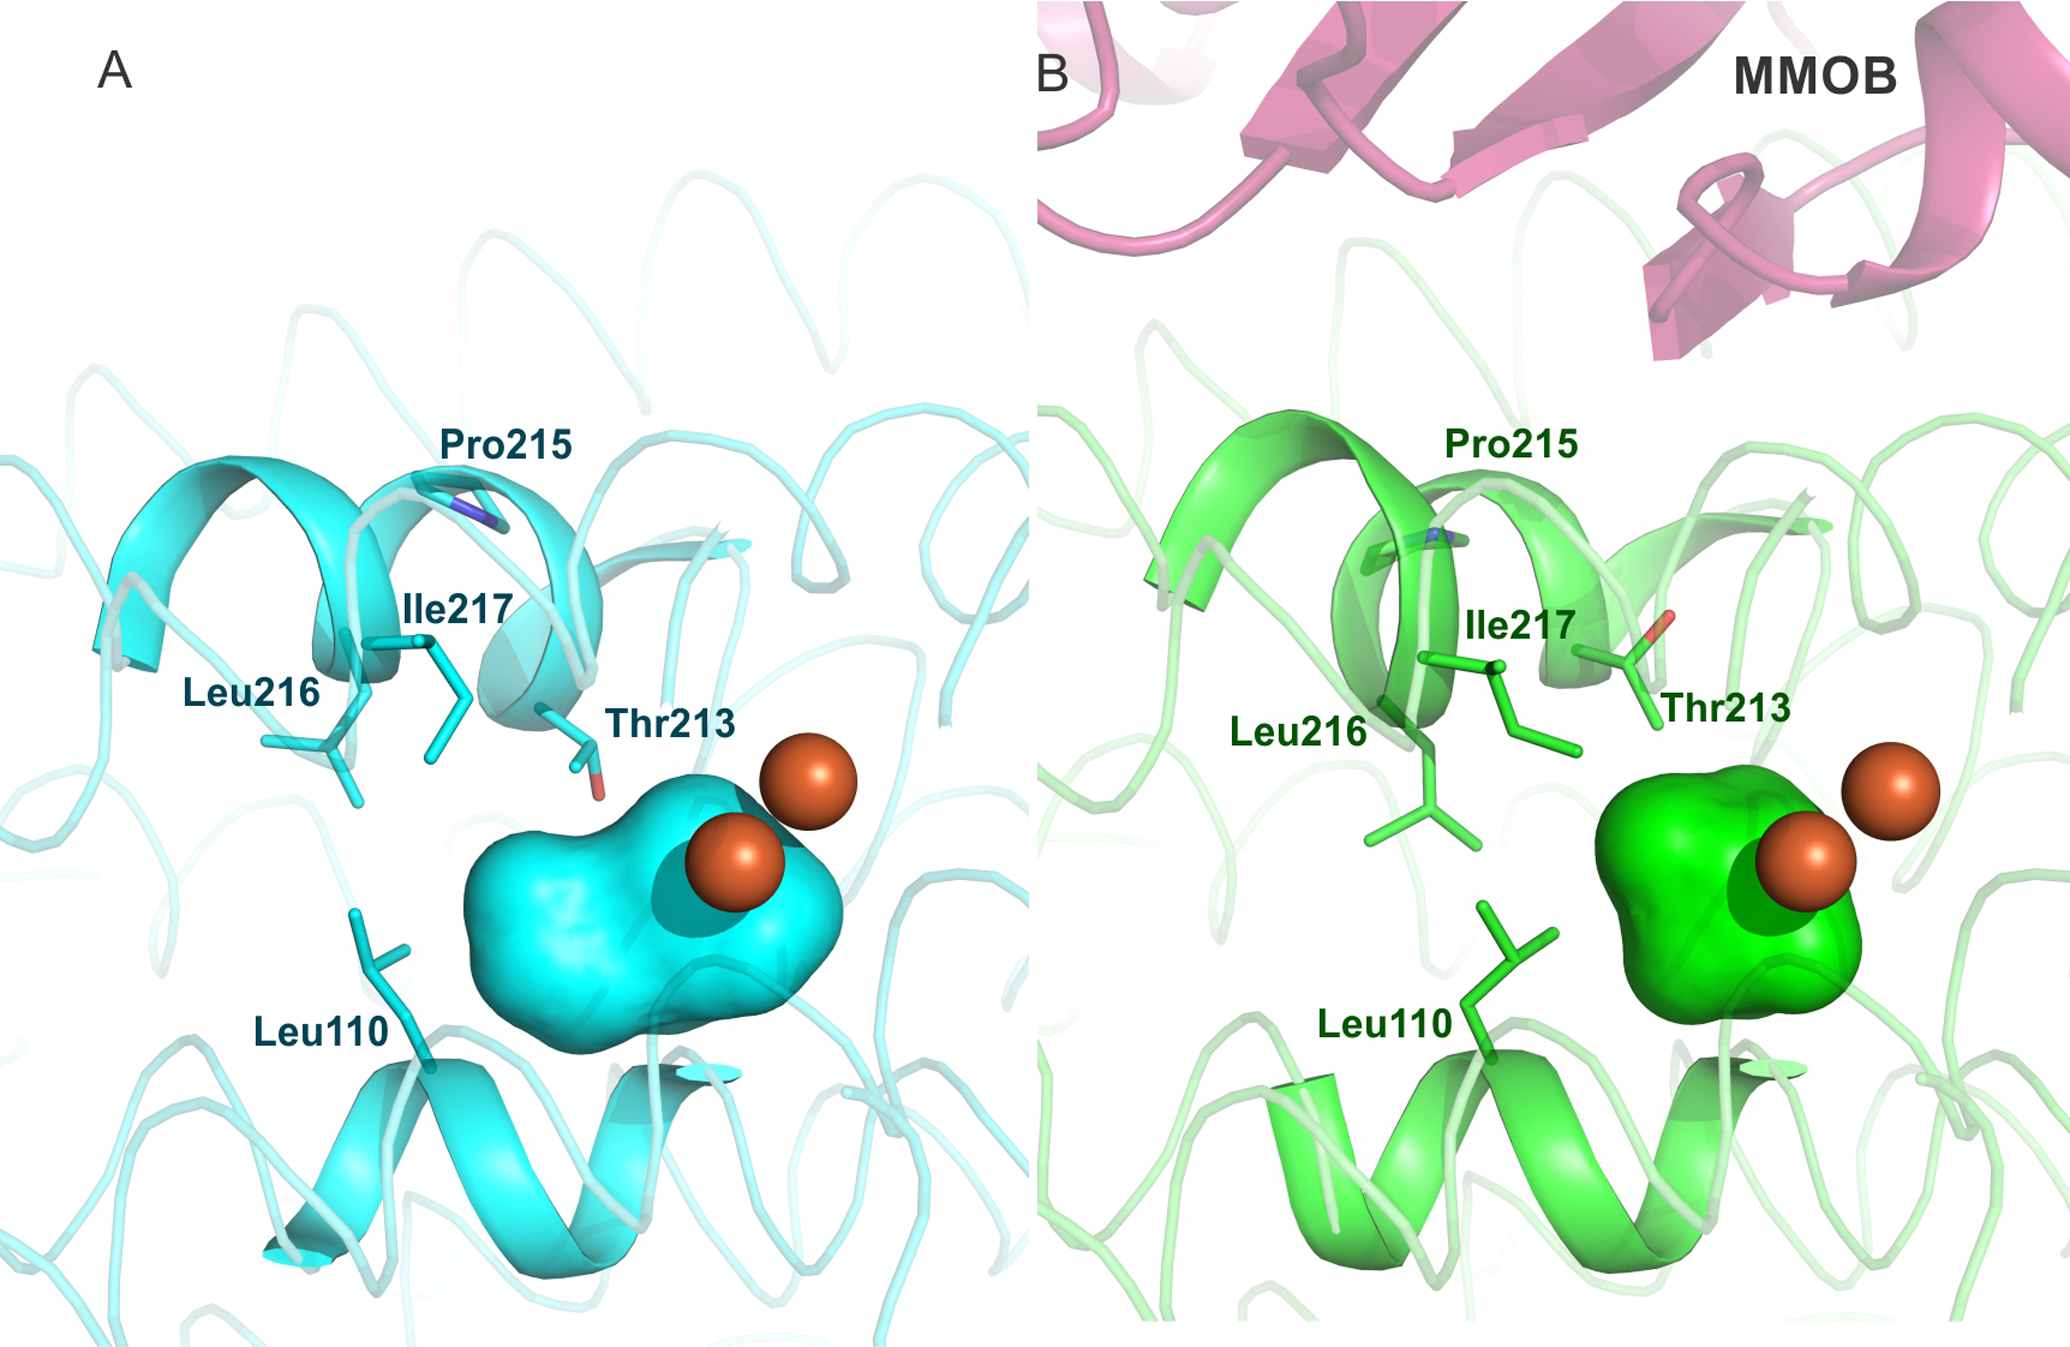
The sMMOH active site cavity (colored surface representation) reduces in size upon MMOB binding, as calculated using HOLLOW.77 Diferric sMMOH in isolation (A) is represented as a cyan colored cartoon while the diferric sMMOH:MMOB complex (B) is shown as a green colored cartoon. MMOB is shown as a magenta colored cartoon. The iron atoms are shown as orange spheres. The active site cavity is indicated by cyan and green surfaces, respectively.