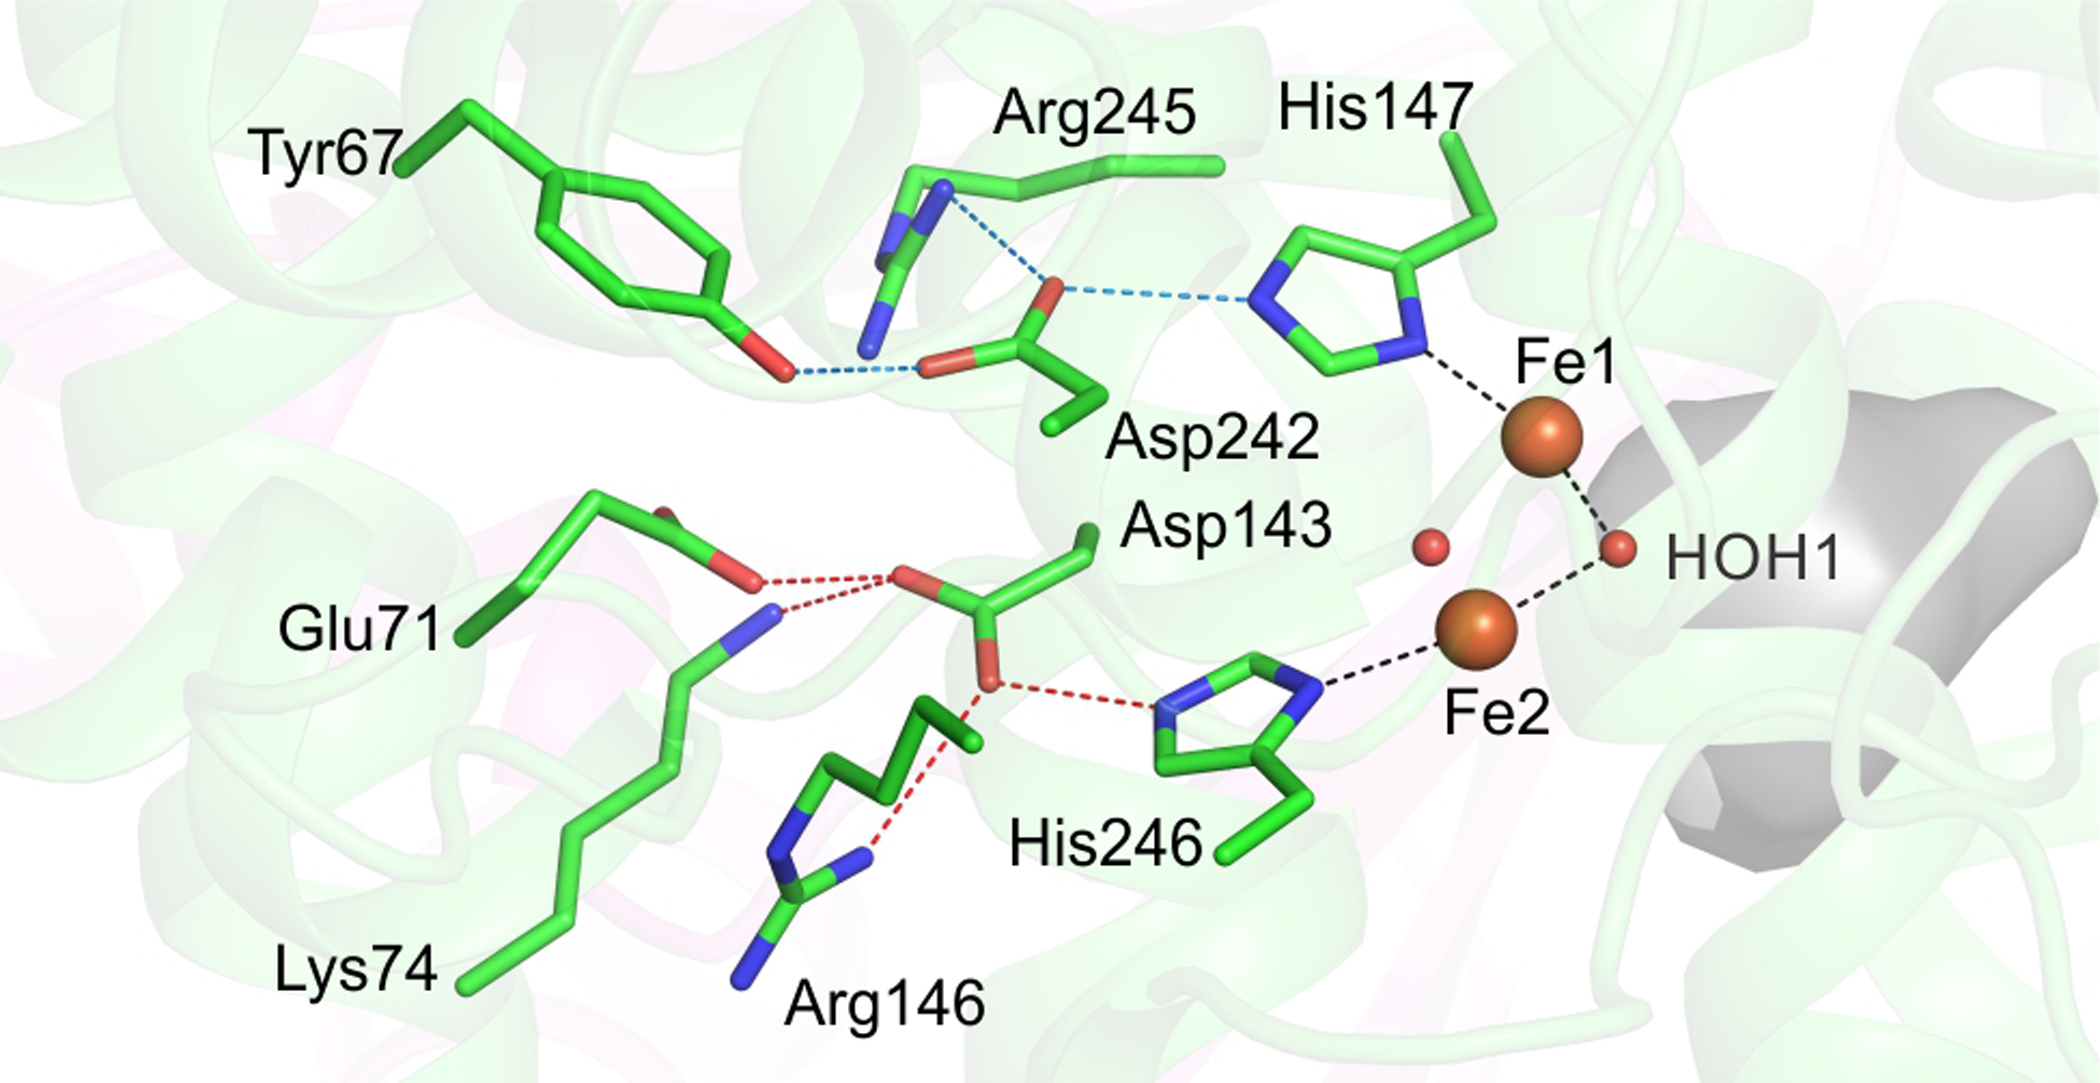
Figure 9.

Strictly conserved hydrogen bond network on the distal side of the diiron cluster is shown. The iron atoms are represented as orange spheres while the bridging μ-hydroxo groups are shown as red spheres. The active site cavity is shown as a grey surface. Black dashed lines depict the trans positioning of the histidine ligands with respect to the μ-hydroxo moiety facing the active site. Red and blue dashed lines show the hydrogen bond network to each of the two histidine residues (His147 - blue, His246 - red).
