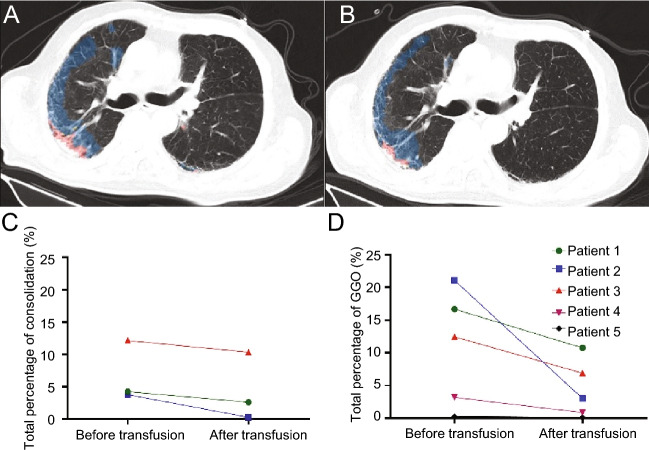
Fig. 1.
CT images before and after CP therapy. A Results of AI-assisted diagnostic system in patient 2 before CPT, blue areas represent GGO in CT images, red areas represent consolidation in CT images. B Results of AI-assisted diagnostic system in patient 2 after CPT. C Consolidation of CT in patients 1, 2, and 3 decreased after the transfusion. D GGO of CT in patients 1, 2, 3, 4, and 5 decreased after CP therapy.

