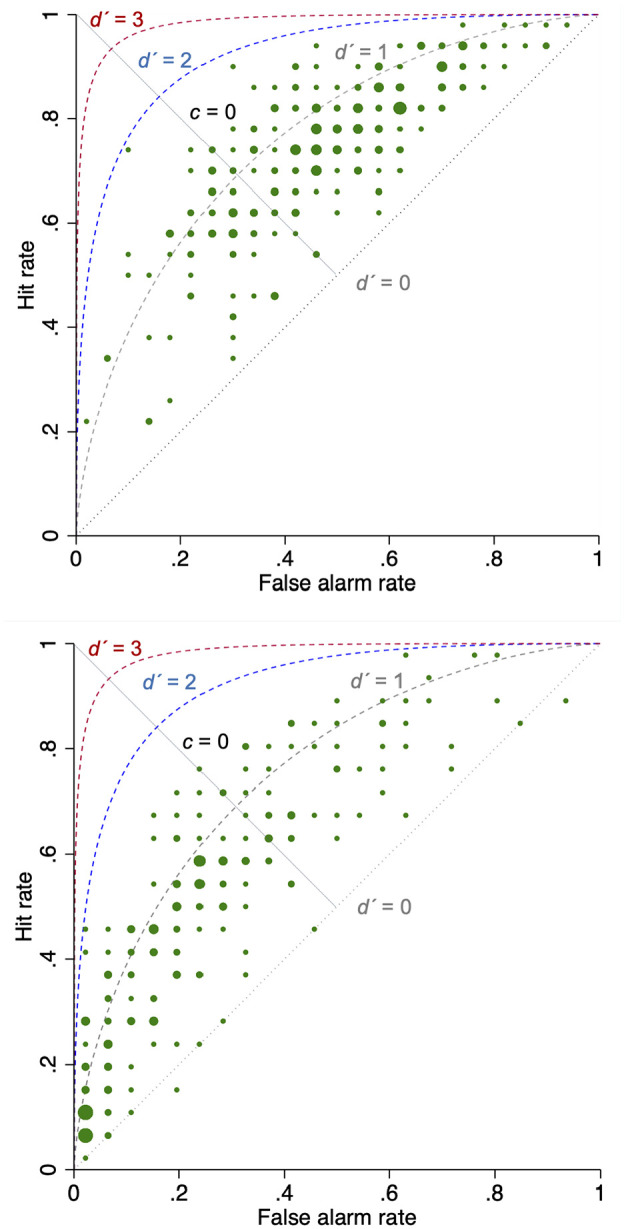
Figure 1.

Top panel: Scatterplot of referral decision making in the colorectal cancer study (N = 252 GPs). Bottom panel: Scatterplot of referral decision making in the lung cancer study (N = 216 GPs).7
aThe scatterplots include theoretical Receiver Operating Characteristic curves at d′ = 0, 1, 2, and 3. The dots are sized by frequency (number of physicians with the same hit and false alarm rates).
