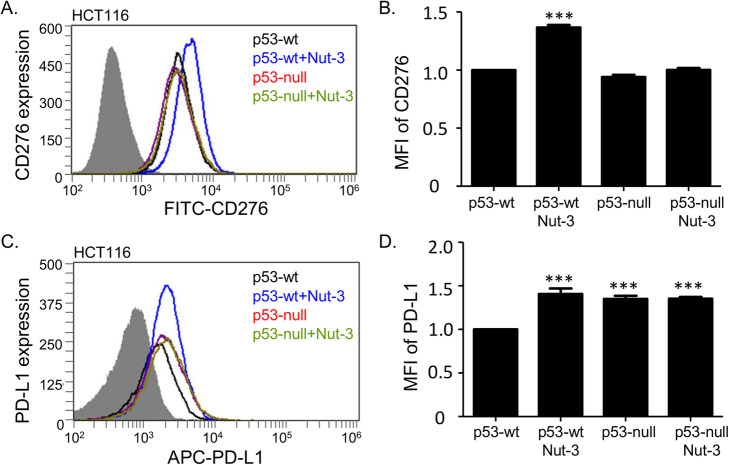
Fig. 3.
Nutlin-3 induces CD276 and PD-L1 proteins on the surface of HCT116 cells. Representative flow cytometry profiles and quantitation of cell surface CD276 (a, b) and PD-L1 (c, d) on HCT116 p53-wt and p53-null cells treated with DMSO or 10 μM Nutlin-3 for 24 h. CD276 and PD-L1 were measured using a FITC- and c APC-conjugated antibody, respectively. In a and c the grey areas correspond to an isotype antibody as a negative control. In b and d, results represent the mean ± SD of technical triplicates, each with 30,000 counted cells. Statistical analysis was performed by one-way ANOVA with Bonferroni post hoc test, *p < 0.05, ***p < 0.001

