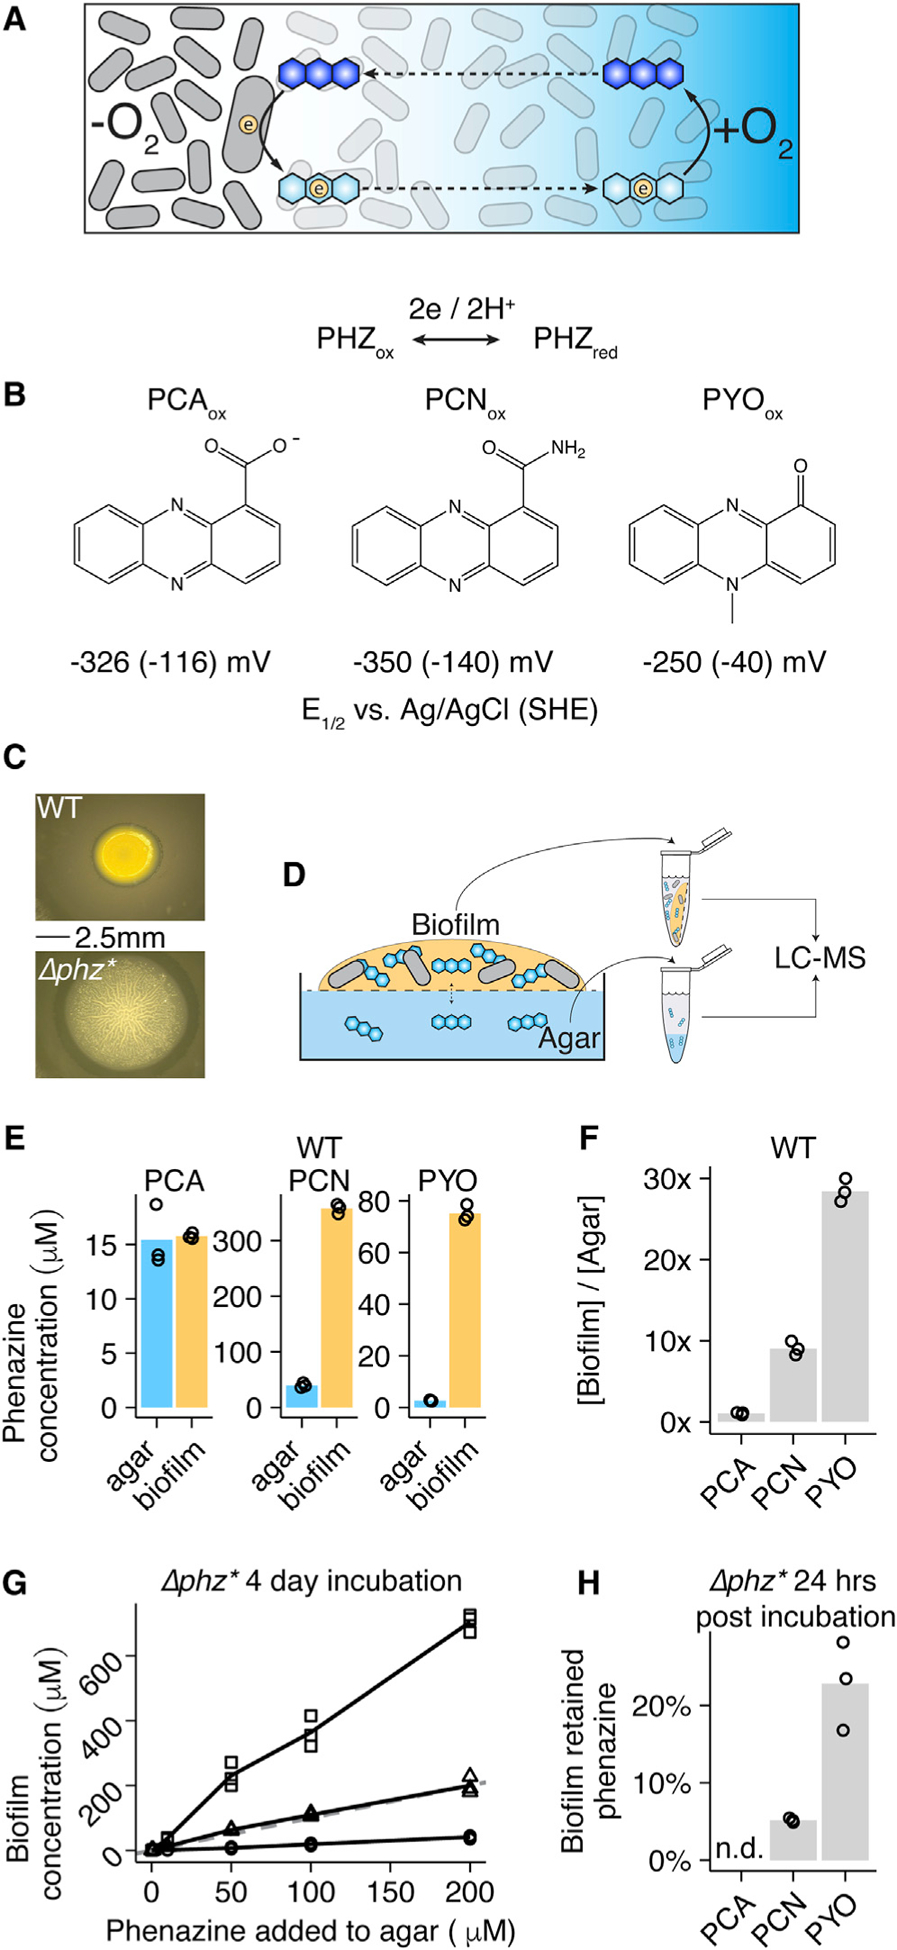
Figure 1. Colony Biofilms Retain PYO and PCN.

(A) Diagram of the phenazine redox cycle in a biofilm. Cells are shown as gray rods, phenazines are shown as blue hexagons, electrons are shown as circles, and the oxygen gradient is shown as the blue background.
(B) Structures of the three studied phenazines in their oxidized states produced by P. aeruginosa—phenazine carboxylate (PCA), phenazine carboxamide (PCN), and pyocyanin (PYO). All three phenazines (PHZ) undergo two proton two electron reductions and the midpoint potentials are shown for the reduction of each phenazine.
(C) Images of WT (top) and Δphz* (bottom) colony biofilms.
(D) Schematic of phenazine extractions from colony biofilms and agar. The 0.2 μm membrane is shown as the dashed line.
(E) Biofilm and agar concentrations for PCA, PCN, and PYO from three WT biofilms.
(F) The same data as (C), represented as retention ratios ([Biofilm]/[Agar]).
(G) Recovered phenazine concentrations from Δphz* colony biofilms grown with different levels of synthetic phenazine in the underlying agar for 4 days. The dashed gray line shows 1:1 (biofilm concentration:added phenazine).
(H) Accumulated phenazine from three Δphz* colony biofilms following 3 days of growth with synthetic phenazine (day 3), and 1 day later after transfer to fresh agar (day 4). Data are represented as the percentage day 4/day 3. PCA was not detected (n.d.) on day 4.
In (E)–(H), values for individual biofilms are shown by open symbols, and lines or bars represent the mean.
See also Figure S1.
