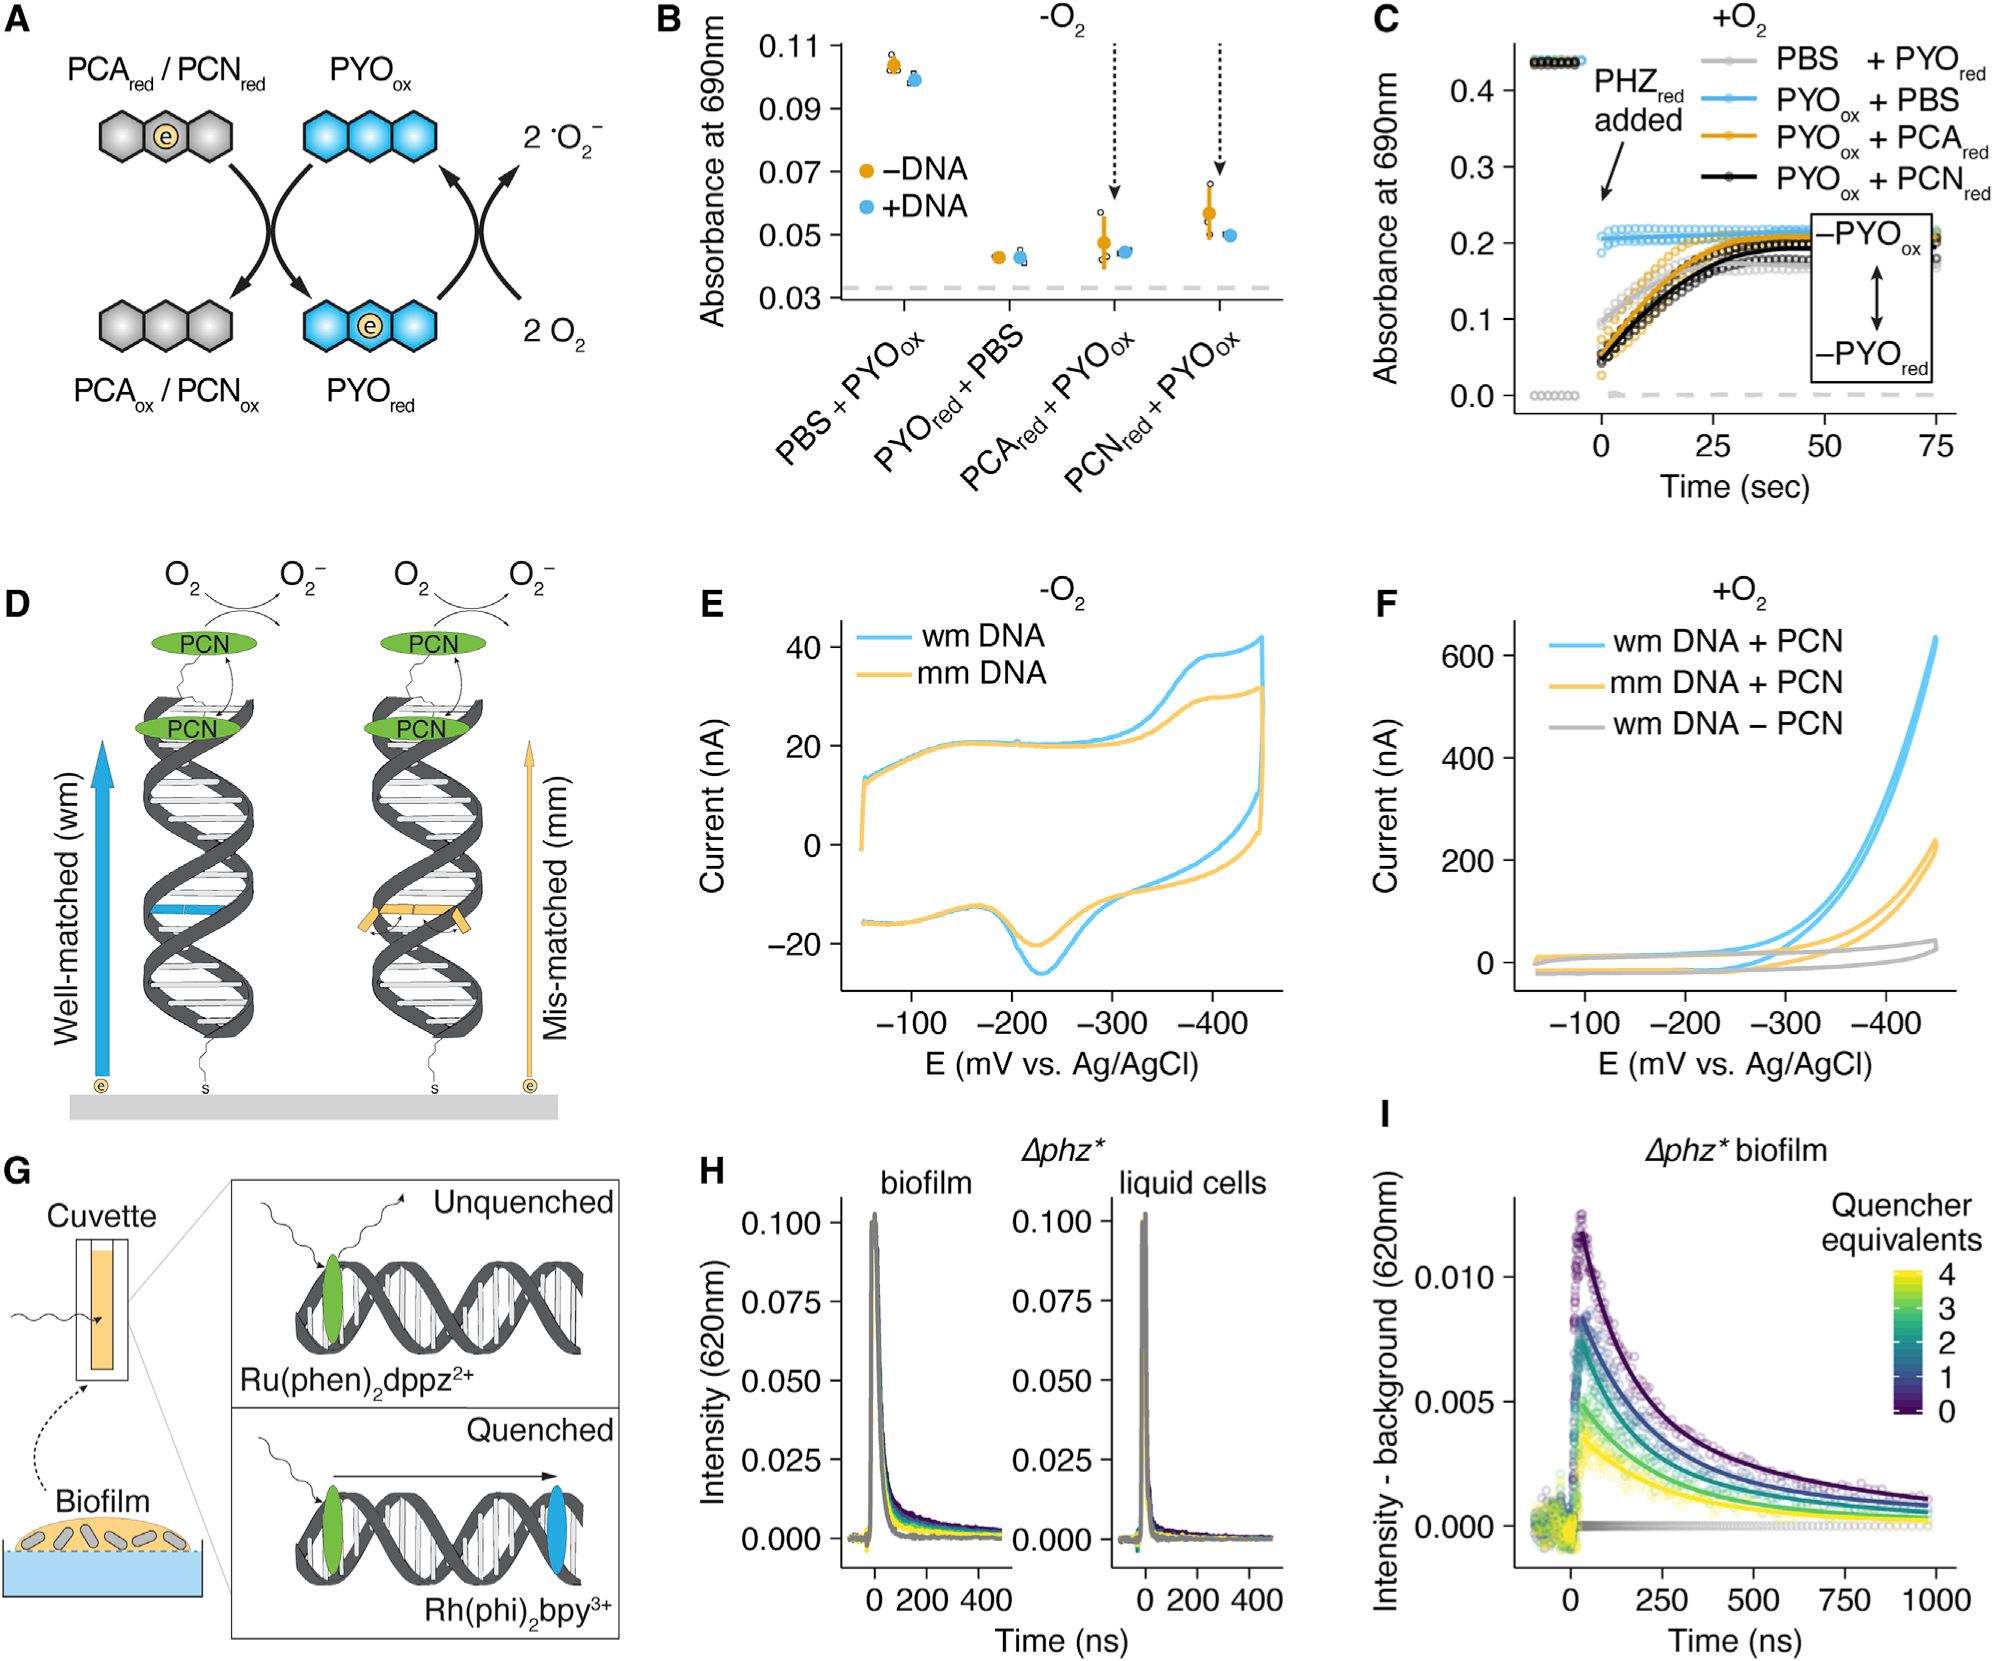
Figure 3. Inter-Phenazine Electron Transfer and DNA Charge Transfer.

(A) Diagram showing an electron transfer reaction in solution between a reduced phenazine and oxidized PYO and between reduced PYO and molecular oxygen.
(B) Reaction progress after 1 min measured at 690 nm for mixtures of phenazines shown in (A), compared to oxidized and reduced PYO alone. Each reaction was performed in the presence and absence of calf thymus DNA. For each condition n = 3 and error bars are one standard deviation.
(C) PYO oxidation state measured at 690 nm over time (diagnostic for oxidized PYO) for different reactions in the presence of oxygen. Points are individual measurements, lines are loess smoothed for each set of triplicate measurements.
(D) Schematic showing a DNA modified electrode with tethered PCN (green oval) and the expected electron transfer for well-matched duplexes (blue arrow and base pair) and duplexes containing a mismatch (orange arrow and base pair). Mismatched bases are less likely to be in a well stacked position, which is necessary for electron transfer through the DNA π-stack. PCN is shown both intercalated into and outside of DNA to convey its reversible DNA binding.
(E) Representative cyclic voltammetry of the well-matched (wmDNA) and mismatched (mmDNA) constructs shown in (D) under anoxic conditions, acquired at 100 mV/s.
(F) Representative cyclic voltammetry of the well matched, mismatched, or no phenazine constructs under the aerobic conditions described in (D), acquired at 100 mV/s.
(G) Diagram of time resolved spectroscopy of the photoexcited electron donor Ru(phen)2dppz2+ quenched by Rh(phi)2bpy3+ with biofilm eDNA.
(H) Comparison of Ru(phen)2dppz2+ fluorescence in the presence of a concentrated liquid P. aeruginosa culture and a resuspended biofilm containing eDNA. Gray lines show background biological fluorescence before Ru(phen)2dppz2+ was added. The color map is the same as (I).
(I) The background subtracted data from the biofilm panel of (H). The amount of Rh(phi)2bpy3+ is color coded as quencher equivalents relative to Ru(phen)2dppz2+.
Dots are raw data, lines are fit bi-exponential decays.
See also Figure S4 and STAR Methods.
