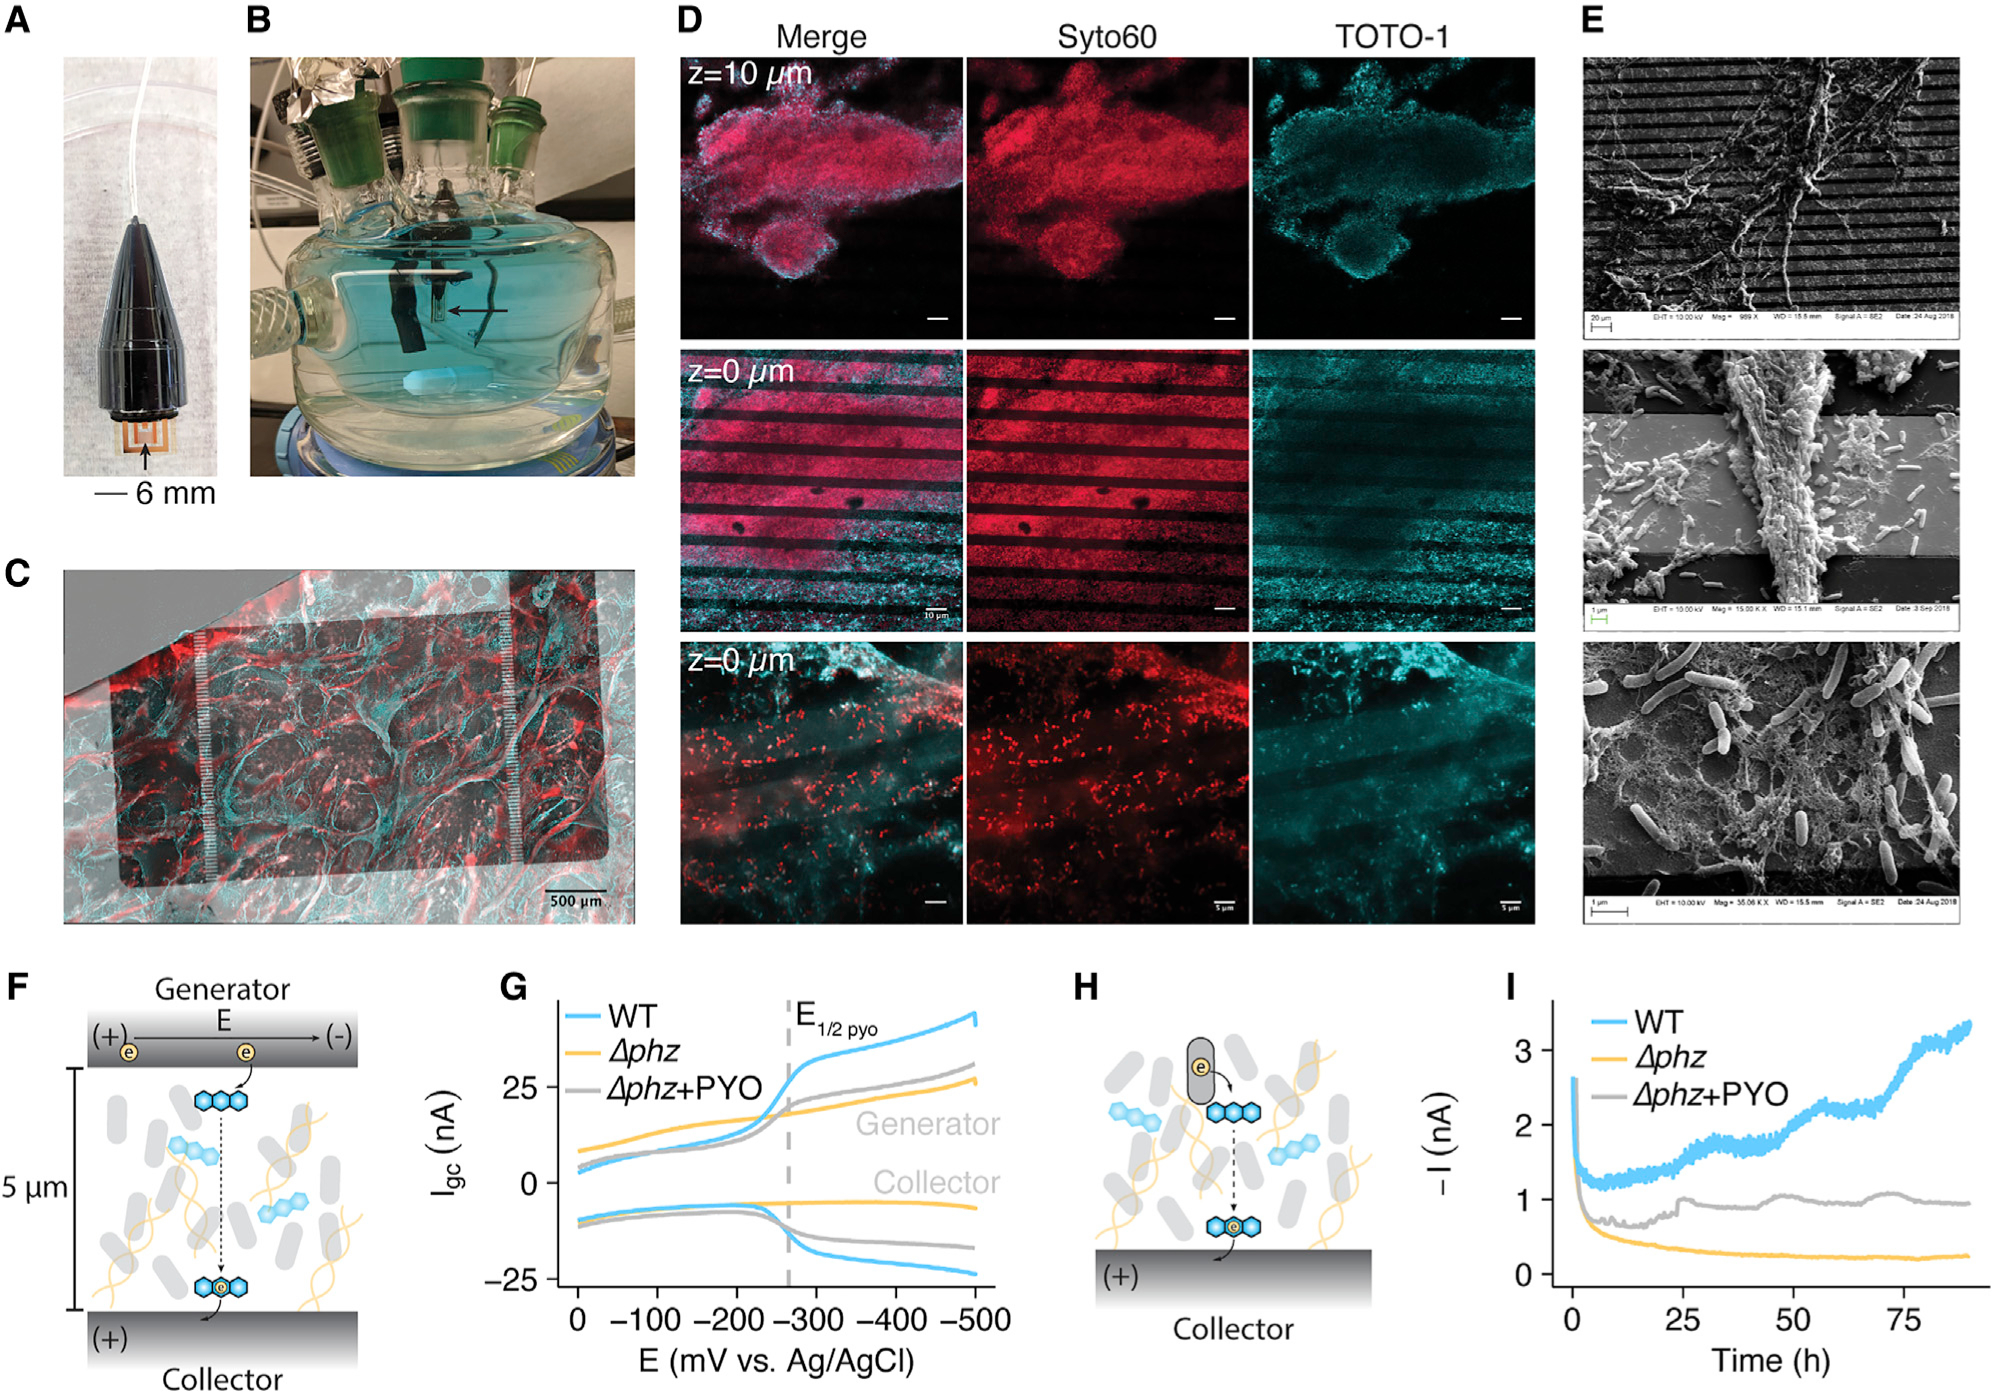
Figure 4. P. aeruginosa Forms Biofilms on Electrodes and Shows PYO-Dependent Conductivity.

(A) Photograph of a sterile IDA.
(B) Photograph of the growth/electrochemical reactor with a submerged IDA in a fresh medium + PYO solution.
(C) A max intensity projection of a WT IDA biofilm imaged using Syto60 (cell permeable – all DNA), shown as red, and TOTO-1 (cell impermeable – eDNA), shown as cyan. Fluorescence channels are overlaid on a transmitted light channel showing the opaque gold regions of the electrode in gray scale.
(D) Fluorescence microscopy of IDA biofilms with the same dyes as in (C). Top: a 63× confocal image of a Δphz* IDA biofilm from a z stack 10 μm above the electrode surface (scale bar = 10 μm). Middle: a confocal image from the same z stack as top, but at the electrode surface (scale bar = 10 μm). Bottom: a confocal slice of a different Δphz* biofilm from a 63× zoom with Airyscan, showing single live cells and eDNA on the electrode surface (scale bar = 5 μm).
(E) SEM images at increasing magnification showing cells and extracellular matrix on the IDA electrode bands.
(F) Diagram showing how a generator-collector (GC) two electrode system can generate current through PYO reduction.
(G) GC data is displayed as the current at each electrode versus the generator potential, (E). Representative measurements are shown for WT, Δphz, and Δphz + PYO biofilms.
(H) Diagram showing how cells generate metabolism dependent current through phenazine reduction.
(I) Metabolic current described in (H) is measured by chronoamperometry for Δphz and WT biofilms over several days. Representative data shown. See also Figure S5.
