
Fig. 1.
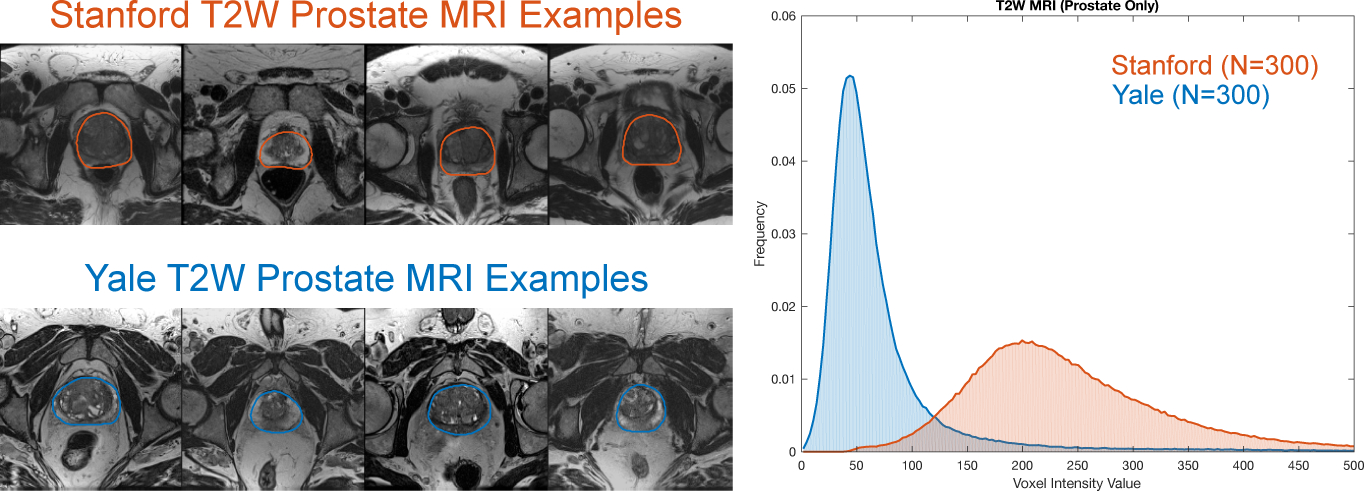
Example axial slices from T2W MR image volumes with manually segmented prostate glands from two sites: (top left) Stanford and (bottom left) Yale. (Right) The histograms of image intensity within the prostate gland (defined by the manual segmentations) for N = 300 subjects from each site show two distinct intensity profiles that result from using different MR scanners.