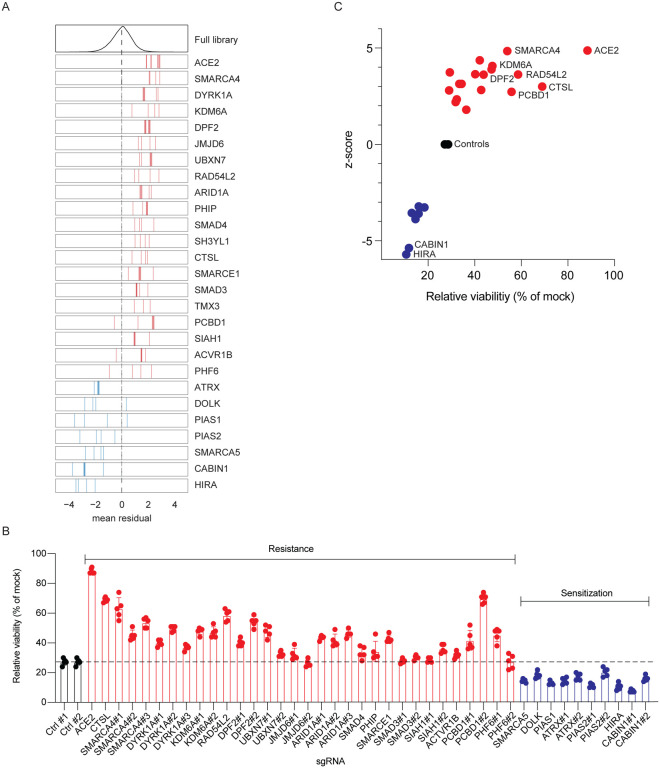
Fig. 3. Arrayed validation of 18 resistance and 7 sensitization hit genes.
(A) Performance in the pooled screen of guide RNAs targeting the 25 genes selected for further validation. The mean residual across the five Cas9-v2 conditions is plotted for the full library (top) and for the 3–4 guide RNAs targeting each gene. Genes that scored as resistance hits are shown in red; genes that scored as sensitization hits are shown in blue. The dashed line indicates a residual of 0. (B) 42 unique sgRNAs targeting 25 genes were introduced into VeroE6 cells. SARS-CoV-2 was added at MOI 0.2 and cell viability was measured at 3 dpi. (C). Z-scores from CRISPR screen correlate with cell viability of individually disrupted genes. Genes with multiple sgRNAs from (B) are averaged to generate one point per gene in (C). Data in (B) and (C) is representative of one of three independent experiments each done in quintuplicate.

