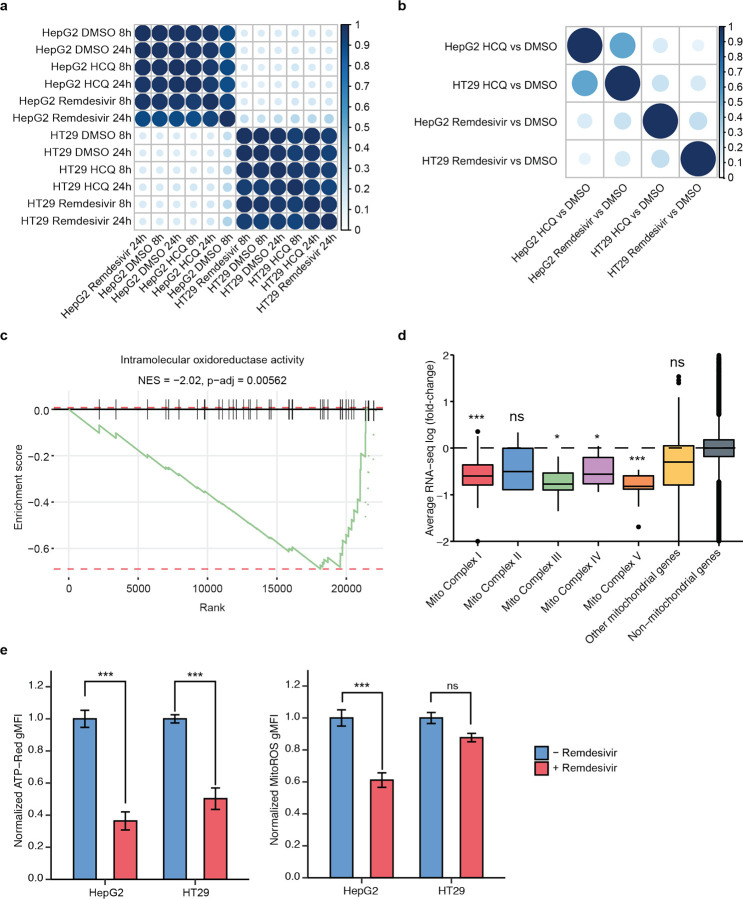
Figure 1. RNA-seq upon remdesivir treatment reveals decreased expression of genes involved in mitochondrial respiration.
a) RNA-seq gene expression correlation matrix among HT29 and HepG2 cell lines treated with remdesivir, HCQ, or DMSO (control) for 8 and 24 hours. b) GSEA correlation matrix of HT29 and HepG2 cell lines treated with remdesivir or HCQ relative to DMSO (control). c) GSEA enrichment plot of intramolecular oxidoreductase activity in HT29 for remdesivir treatment as compared to DMSO control. d) Average mitochondrial RNA-seq log2(fold-change) of HepG2 cells after 24 hour treatment with remdesivir as compared to DMSO control. e) Normalized ATP-red and mitoROS geometric mean of fluorescence intensity (gMFI) for untreated (blue) or remdesivir-treated (red) HepG2 and HT29 cells.

