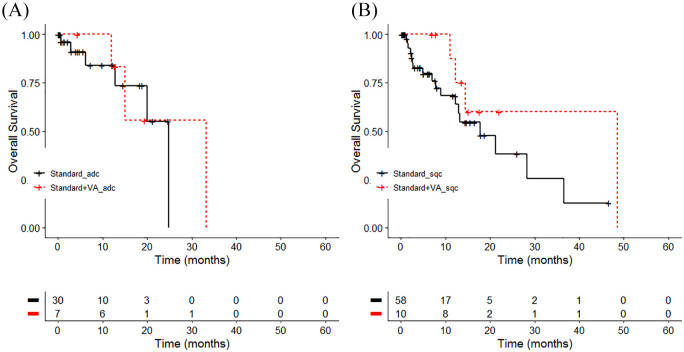
Figure 4.
Overall survival by treatment and histology group. Kaplan-Meier survival curves displaying overall survival in stages I to IIIA non–small cell lung carcinoma (NSCLC) patients in accordance to the NSCLC histology group (A) adenocarcinoma (n = 37), χ2 = 1.7, P = .2, d = 0.44, or (B) squamous cell carcinoma (n = 68), χ2 = 1.6, P = .2, d = 0.31; Standard, oncological standard treatment; Standard + Viscum album L (VA), oncological standard treatment plus add-on VA; adc, adenocarcinoma; lcc, large cell carcinoma; sqc, squamous cell carcinoma.

