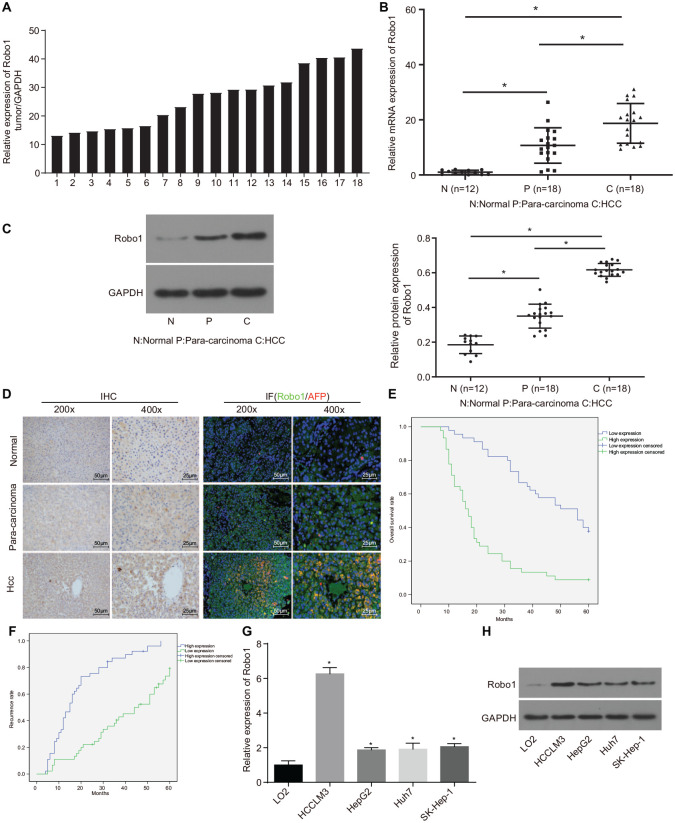
Figure 1.
Robo1 was highly expressed in HCC tissues and cells. (A) the expression of Robo1 in 18 cases of HCC tissue samples determined by RT-qPCR, normalized to GAPDH; the number in the graph represented the sample number; (B) the expression of Robo1 in 18 cases of HCC tissues, 18 cases of paracancerous tissues and 12 cases of normal liver tissues examined by RT-qPCR; (C) the protein expression of Robo1 in HCC, paracancerous and normal liver tissues detected by Western blot analysis. The value of each sample point in the statistical graph = gray value of Robo1 protein band in samples/gray value of GAPDH protein band in samples/normalization value. (*p < 0.05, **p < 0.01, ***p < 0.001); (D) the expression of Robo1 in HCC tissues examined by immunohistochemistry, and immunofluorescence staining (left, 200×; right, 400×); (E) the correlation between survival rate of HCC patients and expression of Robo1 analyzed by Kaplan–Meier method; (F) the correlation between recurrence rate of HCC patients and expression of Robo1 analyzed by Kaplan–Meier method; (G) the expression of Robo1 in HCC and normal liver cell lines; (H) the expression of Robo1 in HCC and normal liver cell lines determined by Western blot analysis; n = 3. Data were analyzed using one-way analysis of variance.
GAPDH, glyceraldehyde-3-phosphate dehydrogenase; HCC, hepatocellular carcinoma; RT-qPCR, reverse transcription quantitative polymerase chain reaction.

