Figure 1.
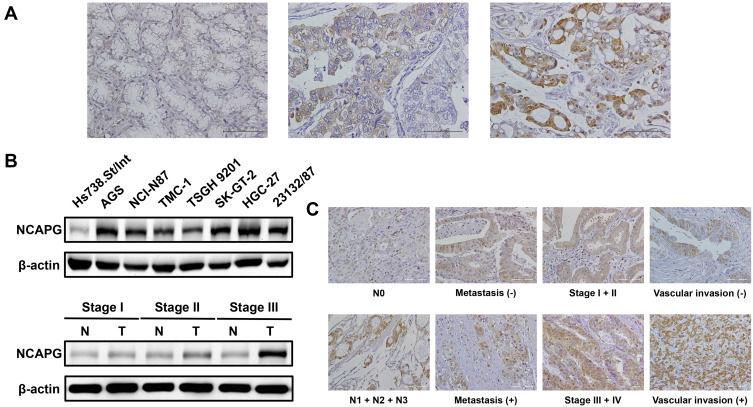
NCAPG expression in gastric tissues and cell lines. (A) GC analyzed by immunostaining with an antibody against NCAPG. Left panel shows a nontumor sample without NCAPG expression; middle panel shows a tumor sample with low NCAPG expression; right panel shows a tumor sample with high NCAPG expression. Magnification: 200×. (B) Endogenous NCAPG protein expression was remarkably increased in GC cell lines and tissues. (C) The representative NCAPG staining for different clinicopathologic characteristics. Magnification: 200×.

