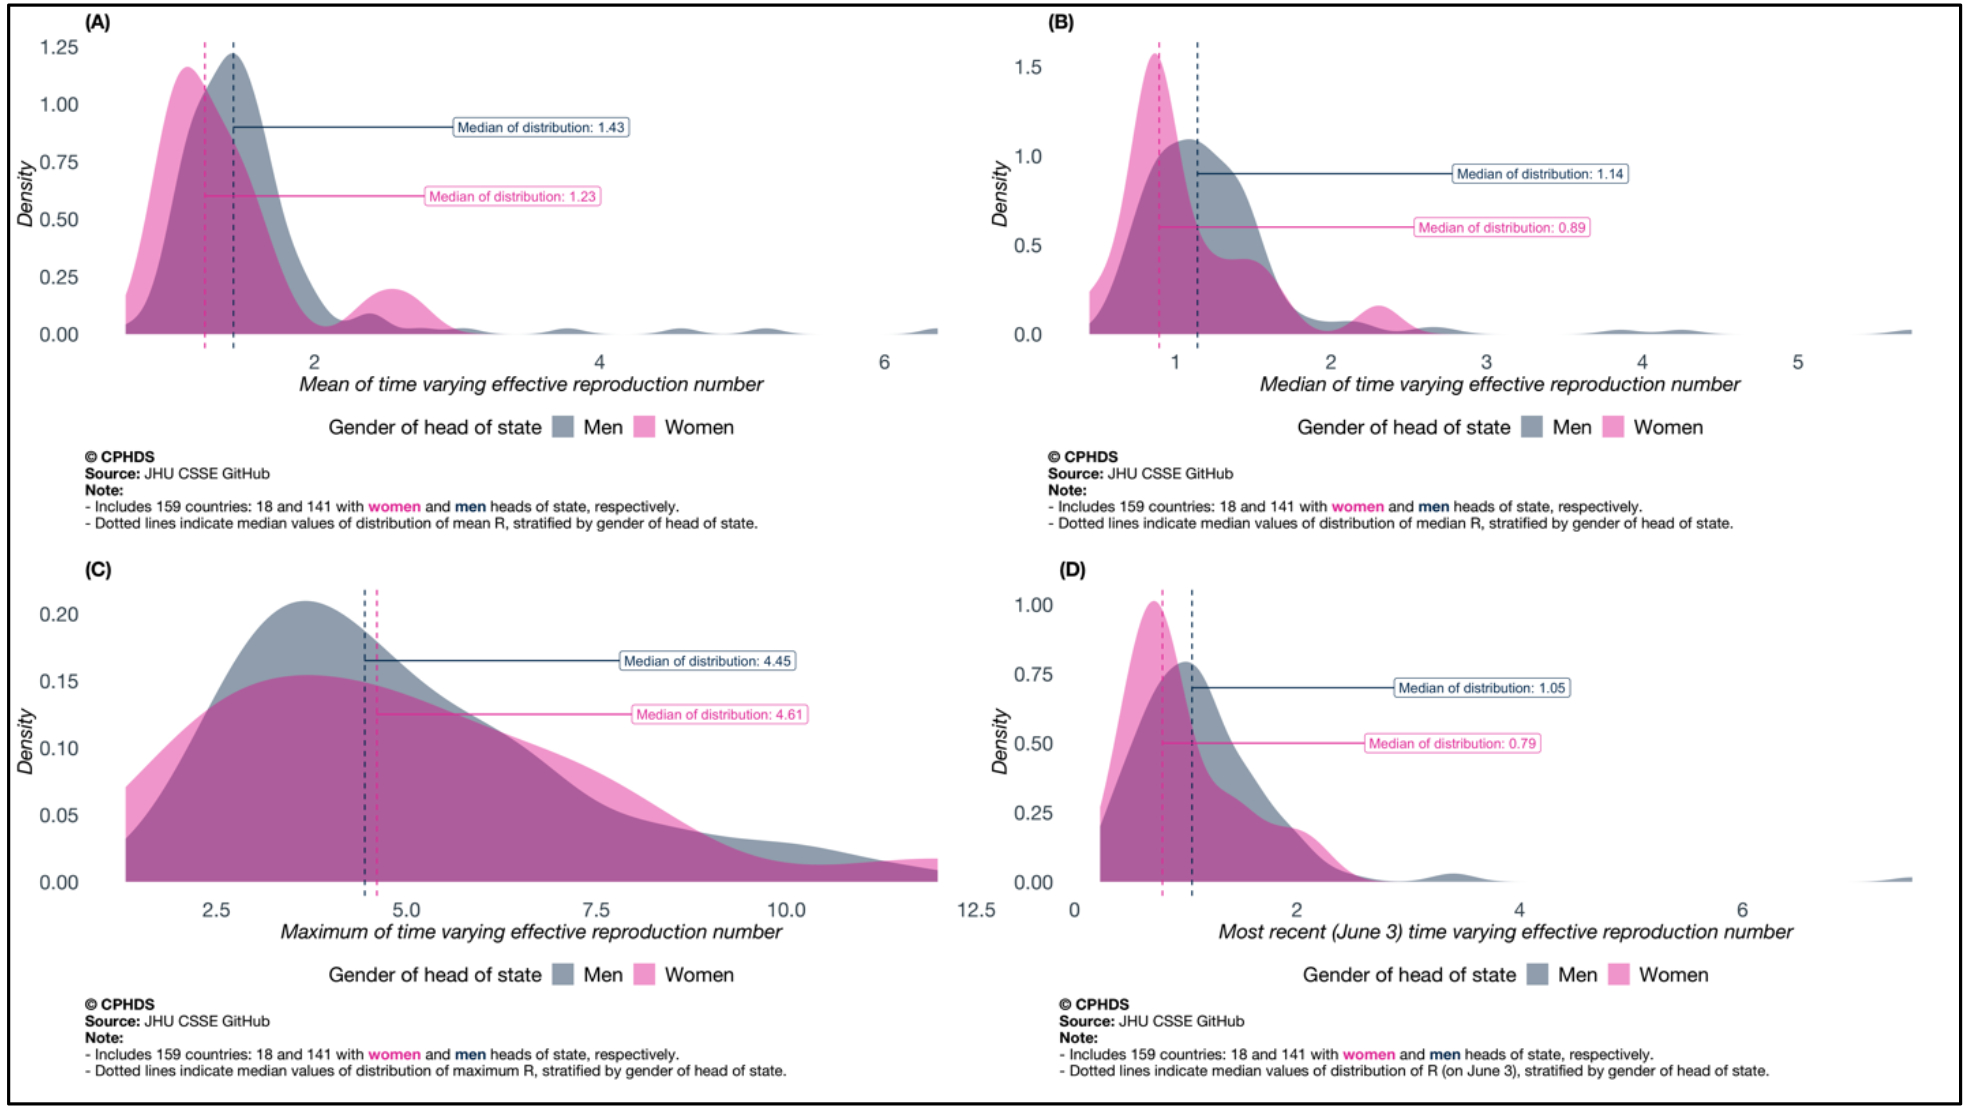
Fig. 2.

Distributions of (A) mean, (B) median, (C) maxima and (D) most recent values of time-varying reproduction number, stratified by gender of head of state. Mean, median, maximum are taken over the time course with time zero defined as the day the reported counts crossed 50 and the last day considered is June 3.
