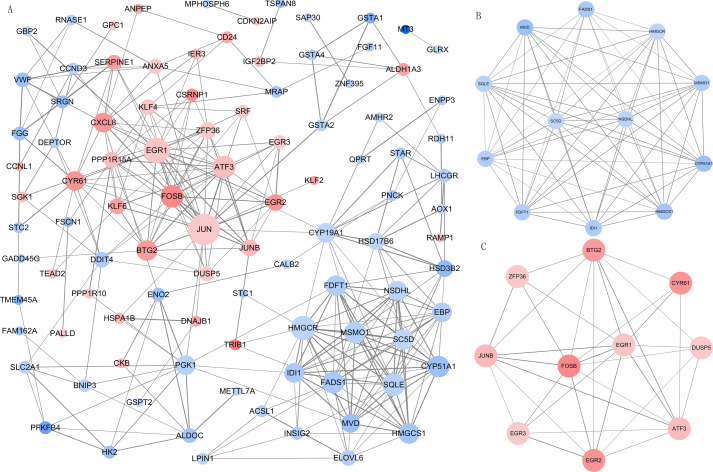
Figure 4. The PPI network and modular analysis.
(A) The PPI network of DEGs. (B) Module 1. (C) Module 2.Node represents gene, node size represents node degree. The orangered and blue nodes represent upregulated and downregulated genes, respectively. The depth of color represents the level of differential expression and the width of lines represents the combined score between two proteins. PPI, protein-protein interaction; DEGs, differentially expressed genes.

