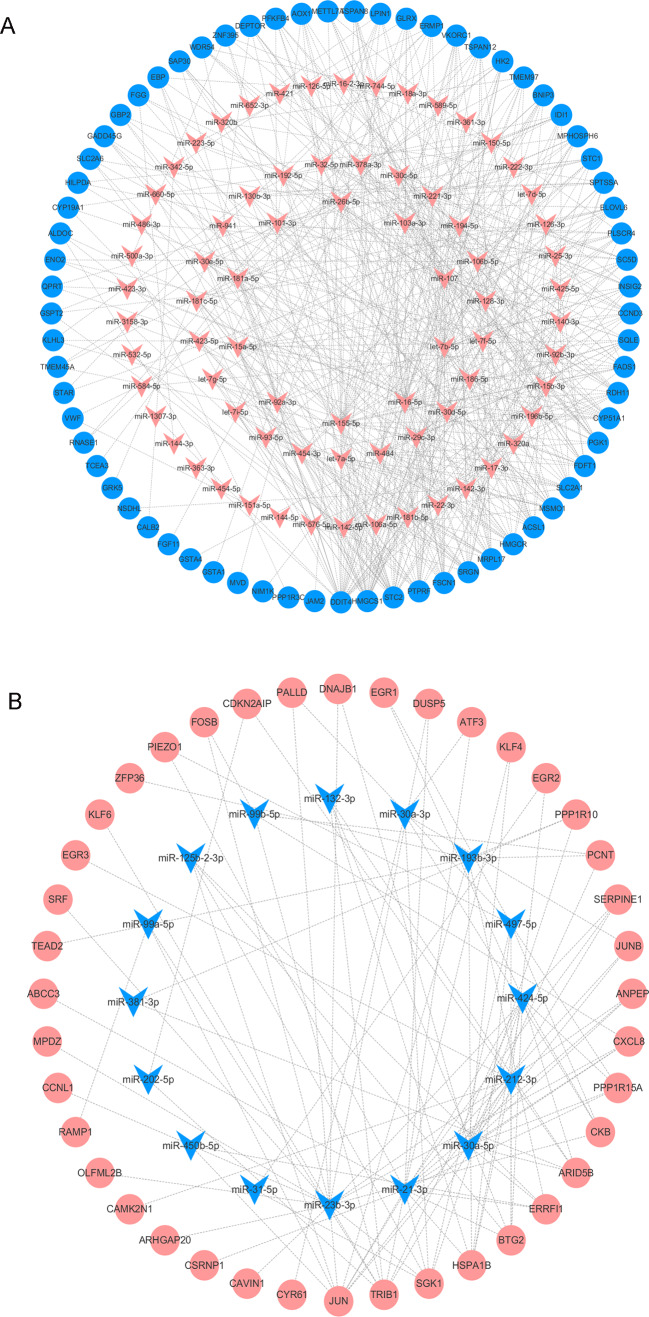
Figure 5. The DEMs-DEGs regulatory network.
(A) The upregulated DEMs and targeted DEGs. (B) The downregulated DEMs and targeted DEGs. Circle nodes represent DEGs and triangle nodes represent DEMs. Orangered represent upregulation and blue represent downregulation. DEGs, differentially expressed genes; DEMs, differentially expressed miRNAs.

