. 2020 Jul 14;296(3):627–637. doi: 10.1148/radiol.2020192793

Figure 3a:

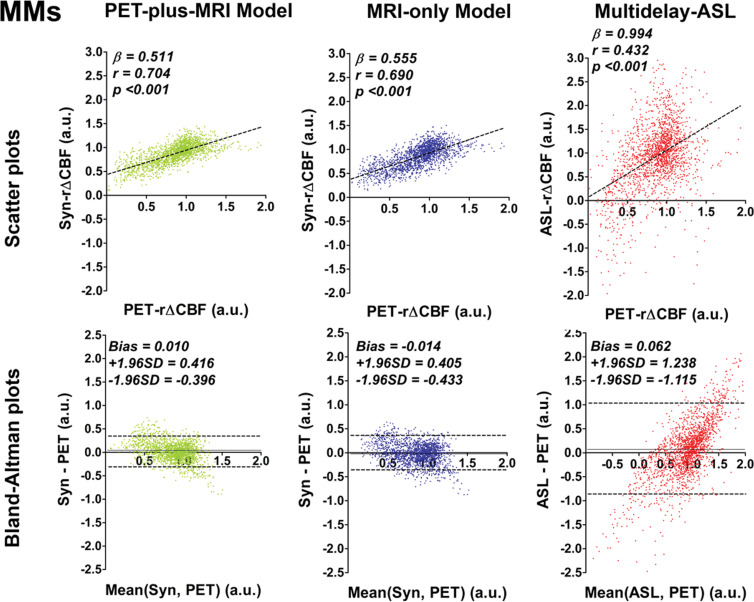
Graphs show correlation and Bland-Altman plots of relative cerebral blood flow change (rΔCBF) from both deep learning models and rΔCBF measured with multidelay arterial spin labeling (ASL rΔCBF), compared with reference PET. (a) Patients with Moyamoya disease (MMs). In patients with Moyamoya disease, both models and ASL rΔCBF correlated with rΔCBF measured with PET (PET-rΔCBF), while correlation coefficients of both models were higher than that of ASL rΔCBF. (b) Healthy control participants (HCs). In healthy control participants, both models correlated with PET, while ASL rΔCBF does not. On Bland-Altman plots, both models showed less bias and reduced variance compared with ASL rΔCBF, which showed a proportional bias to rΔCBF values. Beta is slope of correlation and r is the correlation coefficient. SD = standard deviation, Syn = synthetic, Syn-rΔCBF = synthetic rΔCBF predicted by deep learning models.

Graphs show correlation and Bland-Altman plots of relative cerebral blood flow change (rΔCBF) from both deep learning models and rΔCBF measured with multidelay arterial spin labeling (ASL rΔCBF), compared with reference PET. (a) Patients with Moyamoya disease (MMs). In patients with Moyamoya disease, both models and ASL rΔCBF correlated with rΔCBF measured with PET (PET-rΔCBF), while correlation coefficients of both models were higher than that of ASL rΔCBF. (b) Healthy control participants (HCs). In healthy control participants, both models correlated with PET, while ASL rΔCBF does not. On Bland-Altman plots, both models showed less bias and reduced variance compared with ASL rΔCBF, which showed a proportional bias to rΔCBF values. Beta is slope of correlation and r is the correlation coefficient. SD = standard deviation, Syn = synthetic, Syn-rΔCBF = synthetic rΔCBF predicted by deep learning models.