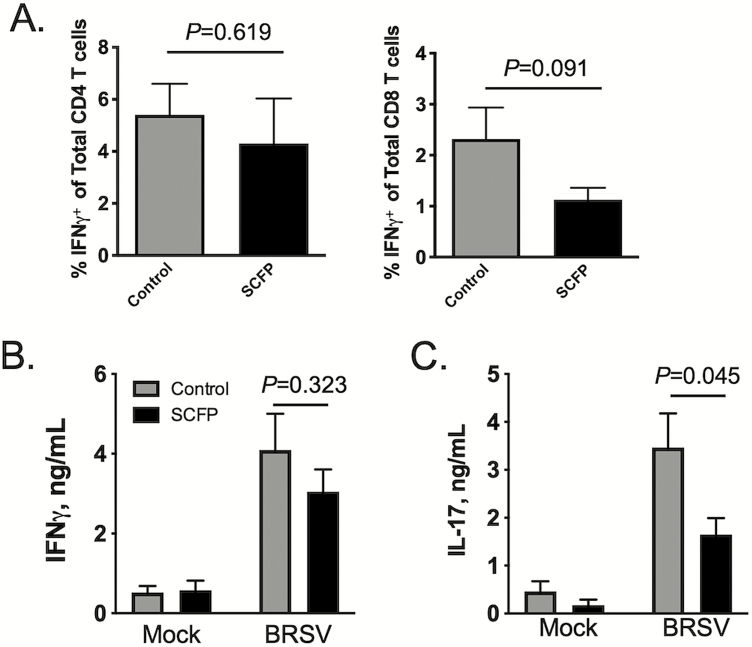
Figure 10.
Impact of SCFP treatment on BRSV-specific T cell responses in the BAL. BAL samples were collected from all calves (SCFP treated and controls) on day 10 postinfection and cryopreserved. (A) BAL cells were thawed and 1 × 10⁶ cells/well were stimulated in vitro with 0.01 MOI BRSV strain 375 for 16 h. Cells were then stained for intracellular IFNγ expression and analyzed by flow cytometry using the gating strategy outlined in Supplementary Figure S3. The frequency of circulating CD4+ IFNγ + (left) and CD8+ IFNγ + (right) is shown. Background IFNγ + production was subtracted and results represent change over unstimulated samples; n = 10 control calves; n = 12 SCFP calves. Data represent means ± SEM. P-values were determined by student’s t-test. (B and C) BAL cells were thawed and plated at 1 × 10⁶ cells/well and stimulated in vitro with 0.01 MOI BRSV strain 375 for 72 h. Culture supernatants were collected and analyzed by commercial ELISA kit for (B) IFNγ and (C) IL-17; n = 10 control calves; n = 12 SCFP calves. Data represent means ± SEM.

