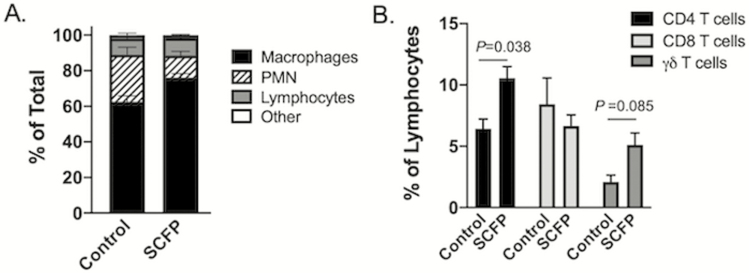
Figure 6.
Altered leukocyte profiles in the BAL of SCFP-treated calves compared with controls. BAL samples were collected from all calves (SCFP treated, n = 12; and controls, n = 10) on day 10 postinfection. (A) Cytospin preparations were made and the BAL cells were differentially stained with Modified Wrights Stain. Numbers of neutrophils, macrophages, lymphocytes, and other cell types were determined by microscopy. Data are depicted as the means ± SEM of the relative frequencies of each population. There are significant differences in the relative frequency of alveolar macrophages (P < 0.003) and neutrophils (P < 0.002) in the airways of SCFP-treated animals compared with controls. (B) BAL cells were also analyzed by flow cytometry to determine the relative frequency of CD4 T cells (black bars), CD8 T cells (light gray bars), and γδ T cells (dark gray bars) in the airways. Data are presented as means ± SEM.

