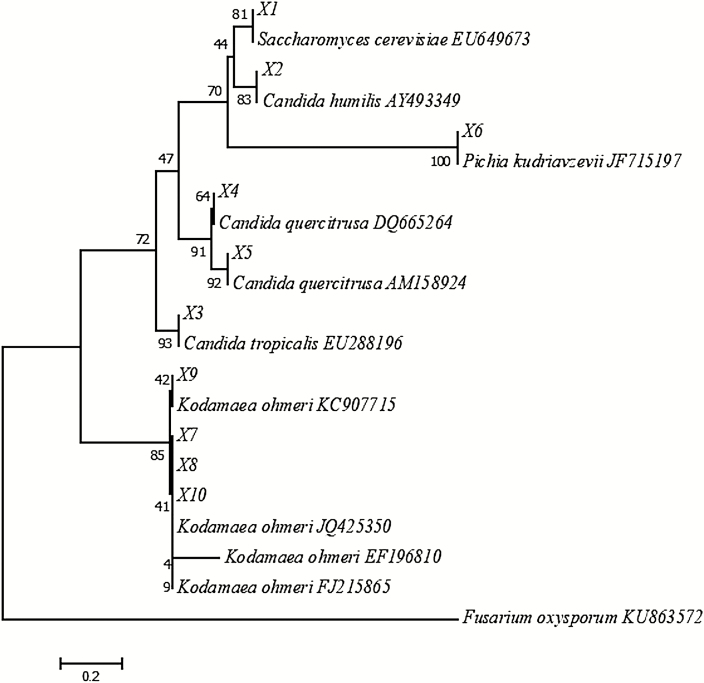
Figure 2.
Phylogenetic tree of yeast species. Phylogenetic tree constructed by the neighbor-joining method showing the position of yeast species based on ITS1 region sequences. The evolutionary distances were computed using the maximum composite likelihood method. Bootstraps value for 1,000 replicates is shown at the nodes. X1 to X10 represent OTU at the species level. Fusarium oxysporum was used as an outgroup. Scale bar indicates an evolutionary distance of 0.2 nucleotide substitution.

