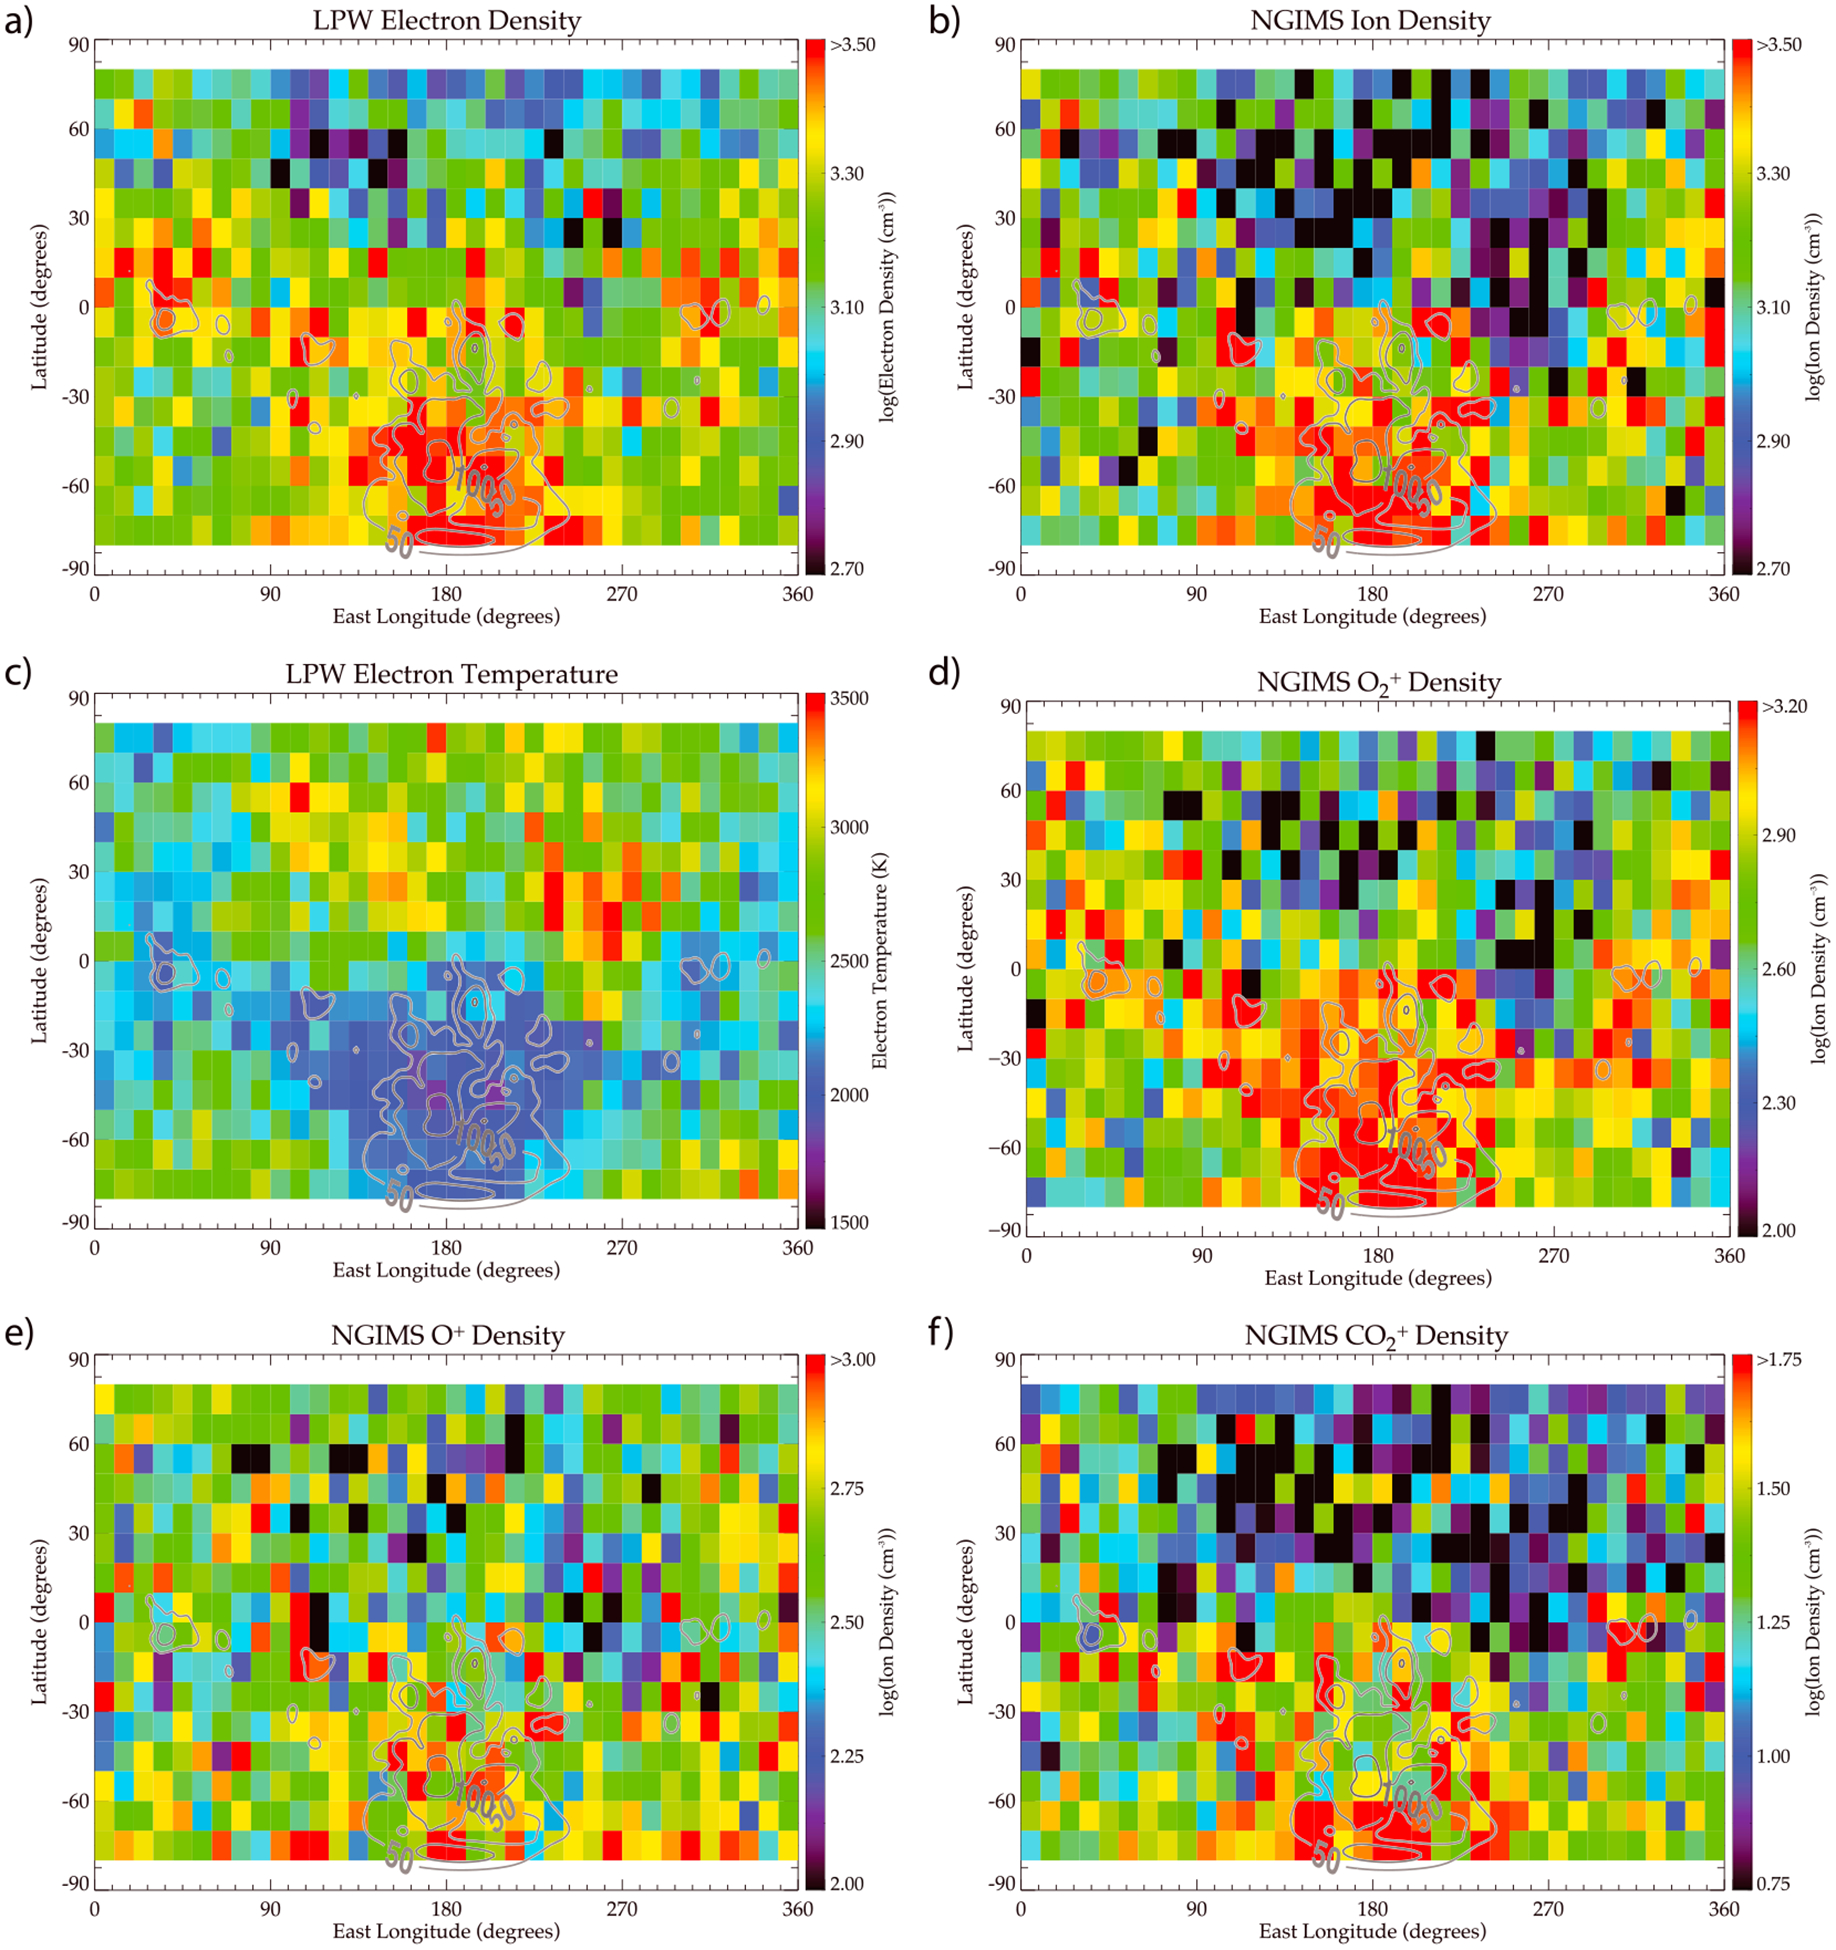
Figure 1.

(a) LPW electron density at 300- to 320-km altitude as a function of areographic latitude and longitude. The color indicates the median value in a 10° by 10° latitude-longitude bin. White bins contain fewer than five data points. Gray contours show magnetic field magnitudes (Cain et al., 2003) of 50, 100, and 200 nT at 310 km. (b) As panel (a) but for NGIMS total ion density. (c) As panel (a) but for LPW electron temperature. (d) As panel (a) but for NGIMS ion density. (e) As panel (a) but for NGIMS O+ ion density. (f) As panel (a) but for NGIMS ion density. LPW = Langmuir Probe and Waves; NGIMS = Neutral Gas and Ion Mass Spectrometer.
