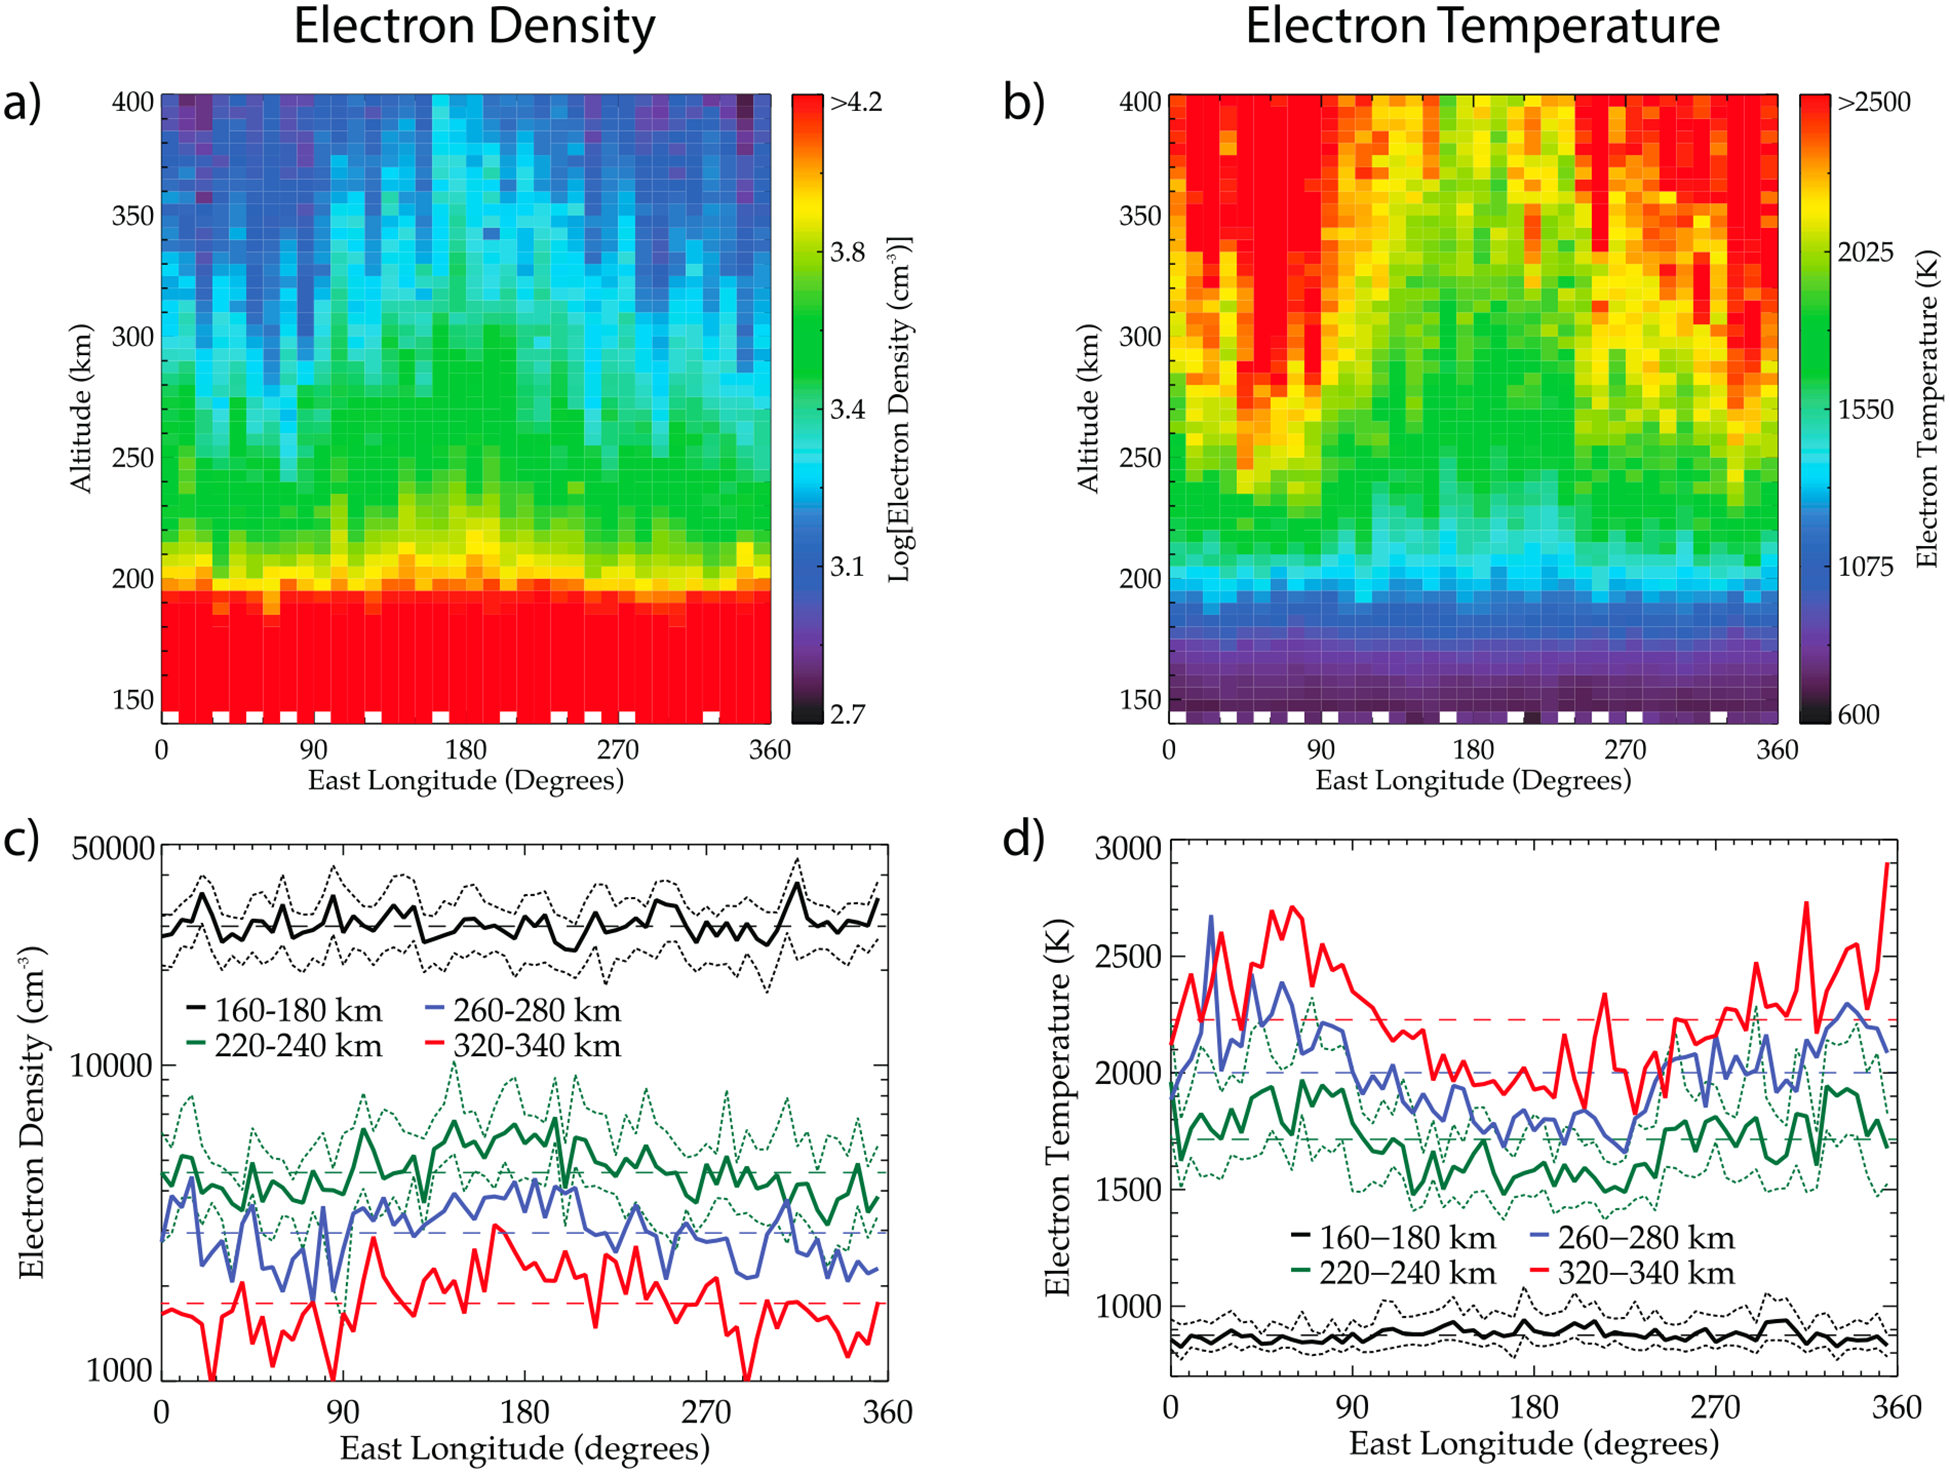
Figure 2.

(a) MAVEN LPW electron density measurements as a function of altitude and longitude from latitudes poleward of 30°S and solar zenith angles less than 90°. The color indicates the median electron density in each 5 km altitude by 10° longitude bin. The white bins indicate those with fewer than five available measurements. (b) As in Figure 2a but for electron temperature. (c) Median MAVEN LPW electron density as a function of longitude, calculated using data from latitudes poleward of 30°S and solar zenith angles less than 90° at four different altitude ranges: 160–180 km (black), 220–240 km (green), 260–280 km (blue), and 320–340 km (red). The black dashed horizontal line shows the median value of all densities at 160–180 km, and so on for other altitude ranges. The two dotted black (green) lines show lower and upper quartiles for 160–180 km (220–240 km). (d) As in Figure 2c but for electron temperature.
