
Figure 3.
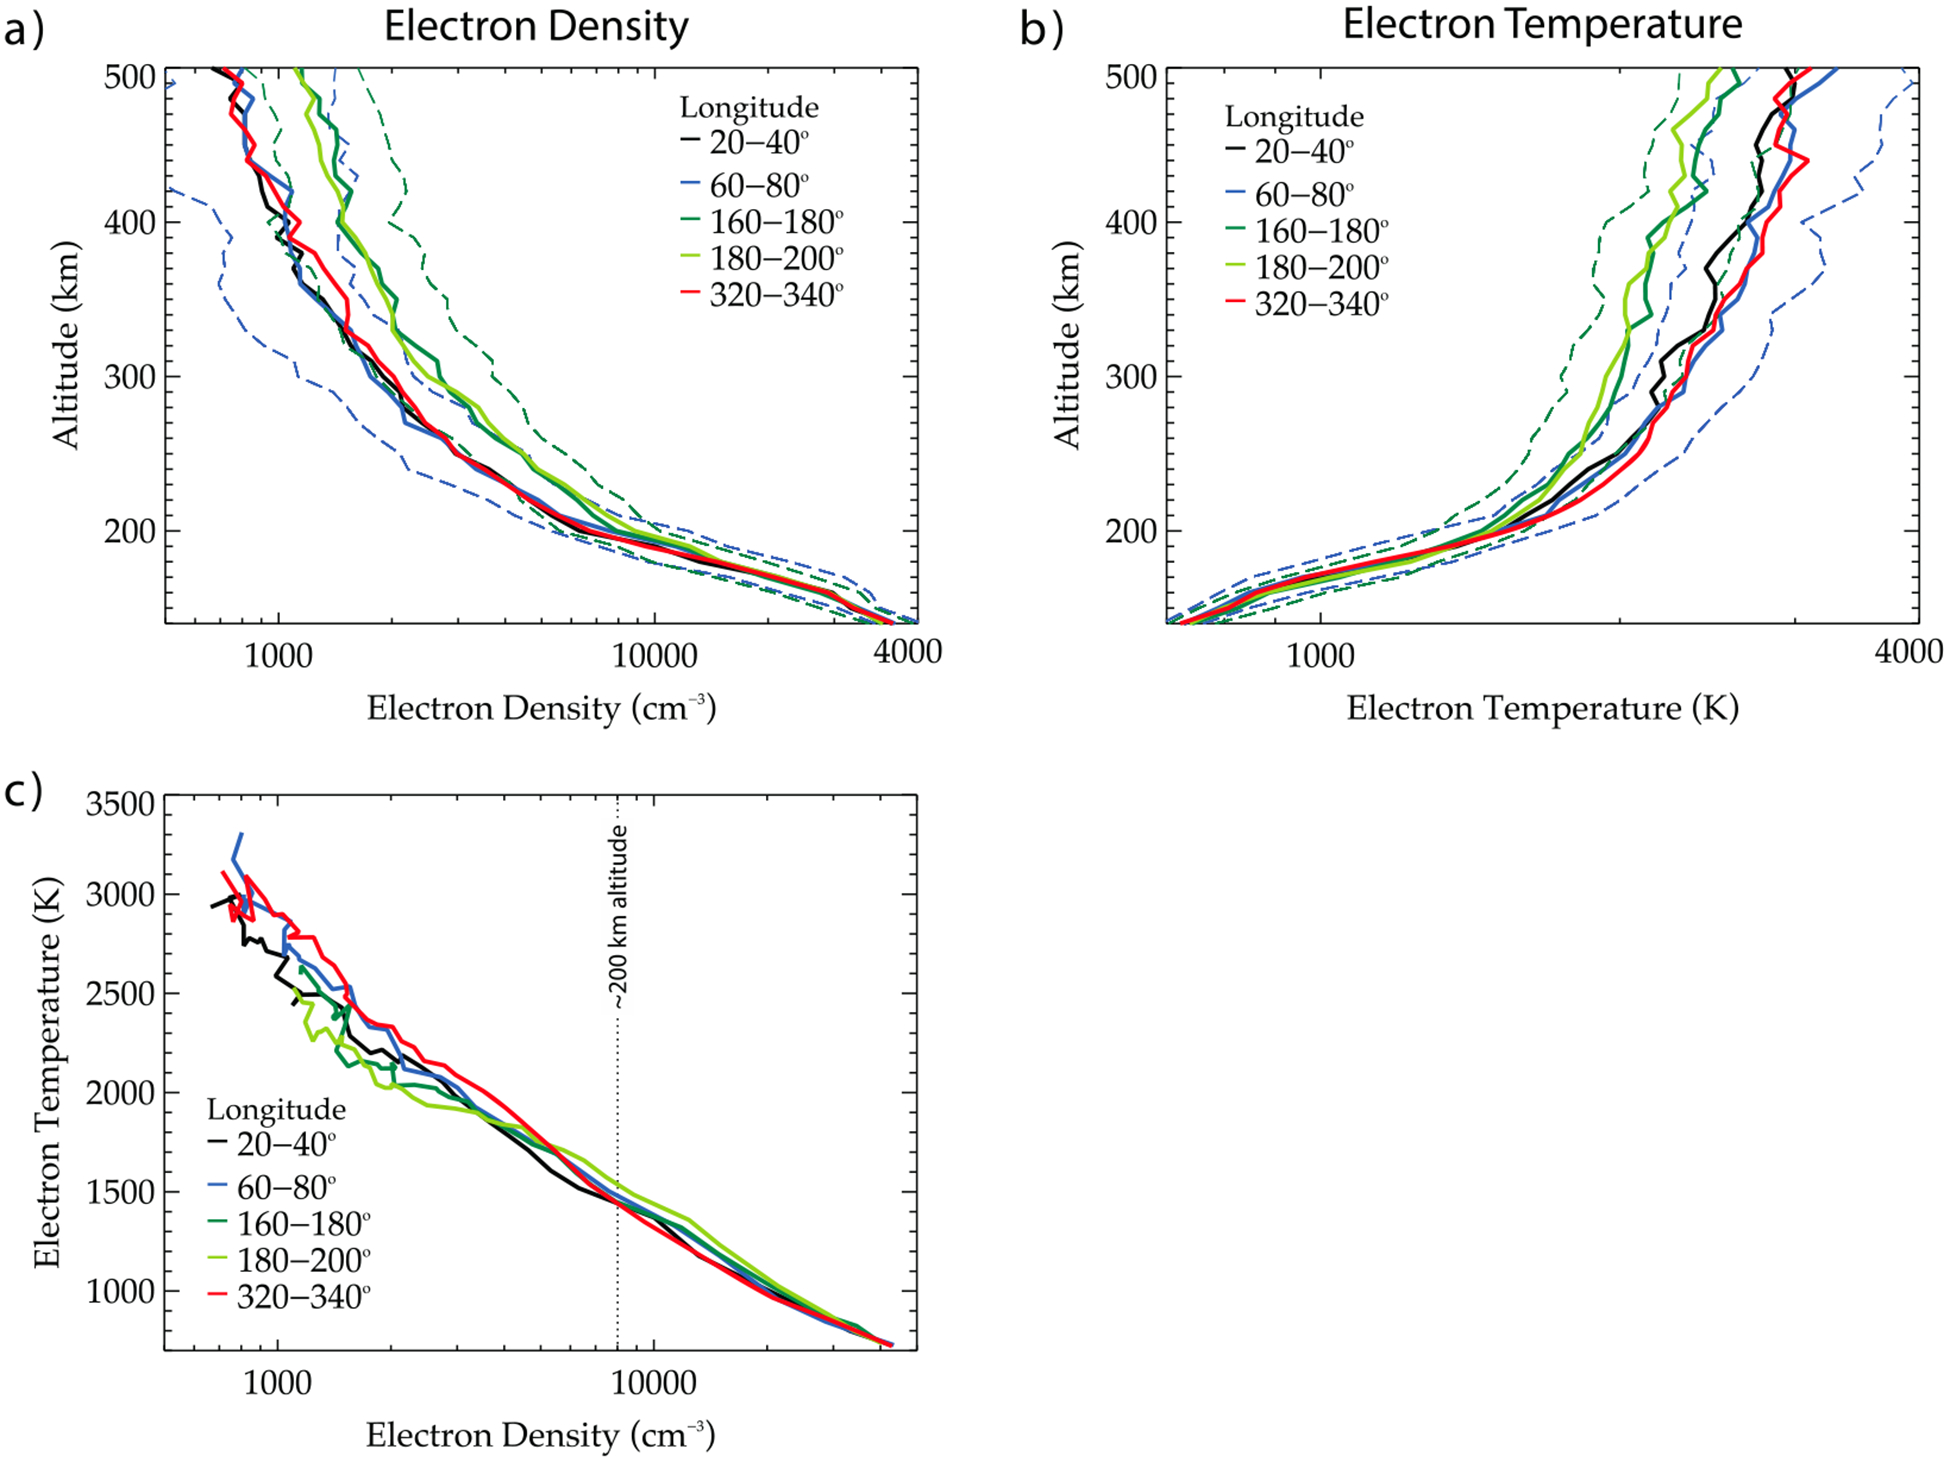
(a) Median MAVEN LPW electron density altitude profiles, calculated using data from latitudes poleward of 30°S and solar zenith angles less than 90°, and five different longitude ranges: 20–40° (black), 60–80° (blue), 160–180° (dark green), 180–200° (light green), and 320–340° (red). The dashed lines show upper and lower quartiles for data at 60°–80° (weak crustal fields) and 160°–180° (strong crustal fields). (b) As in Figure 3a but for electron temperature. (c) Electron temperature profiles from Figure 3b as a function of electron density profiles from Figure 3a.