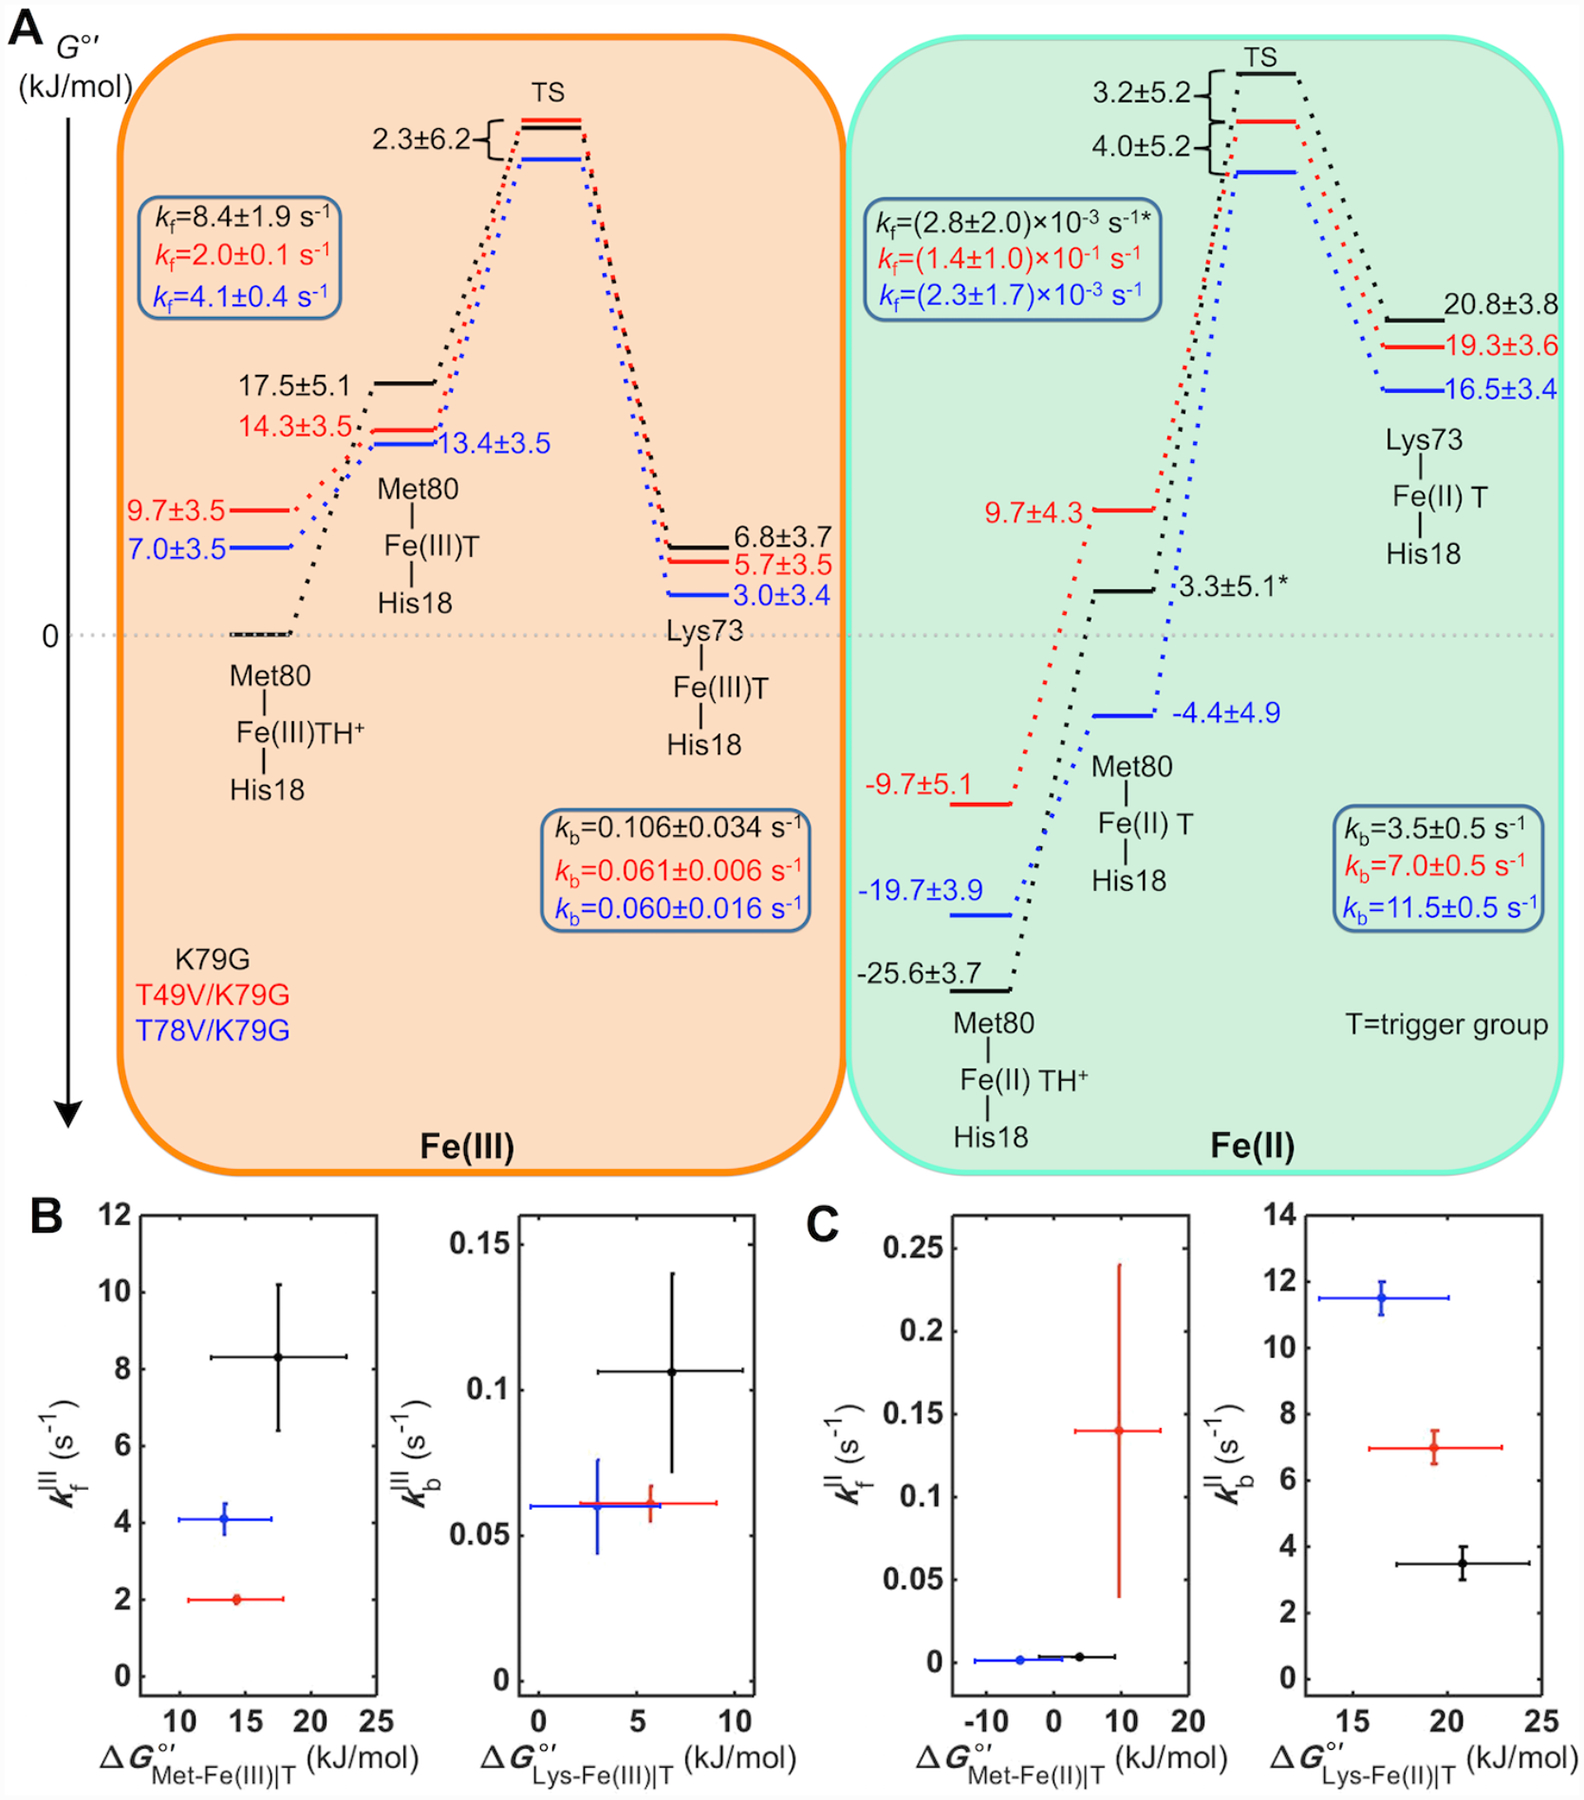
Figure 11.

(A) Energy diagram for the alkaline transition in ferric and ferrous K79G, T49V/K79G, and T78V/K79G at pH 7.4. The asterisk-labeled energy level and kfII value for K79G are calculated based on the assumption pKHII = pKHIII + 2. (B, C) The dependencies of the rate constants kf and kb on energies of the corresponding ground states in (B) ferric and (C) ferrous K79G, T49V/K79G, and T78V/K79G.
