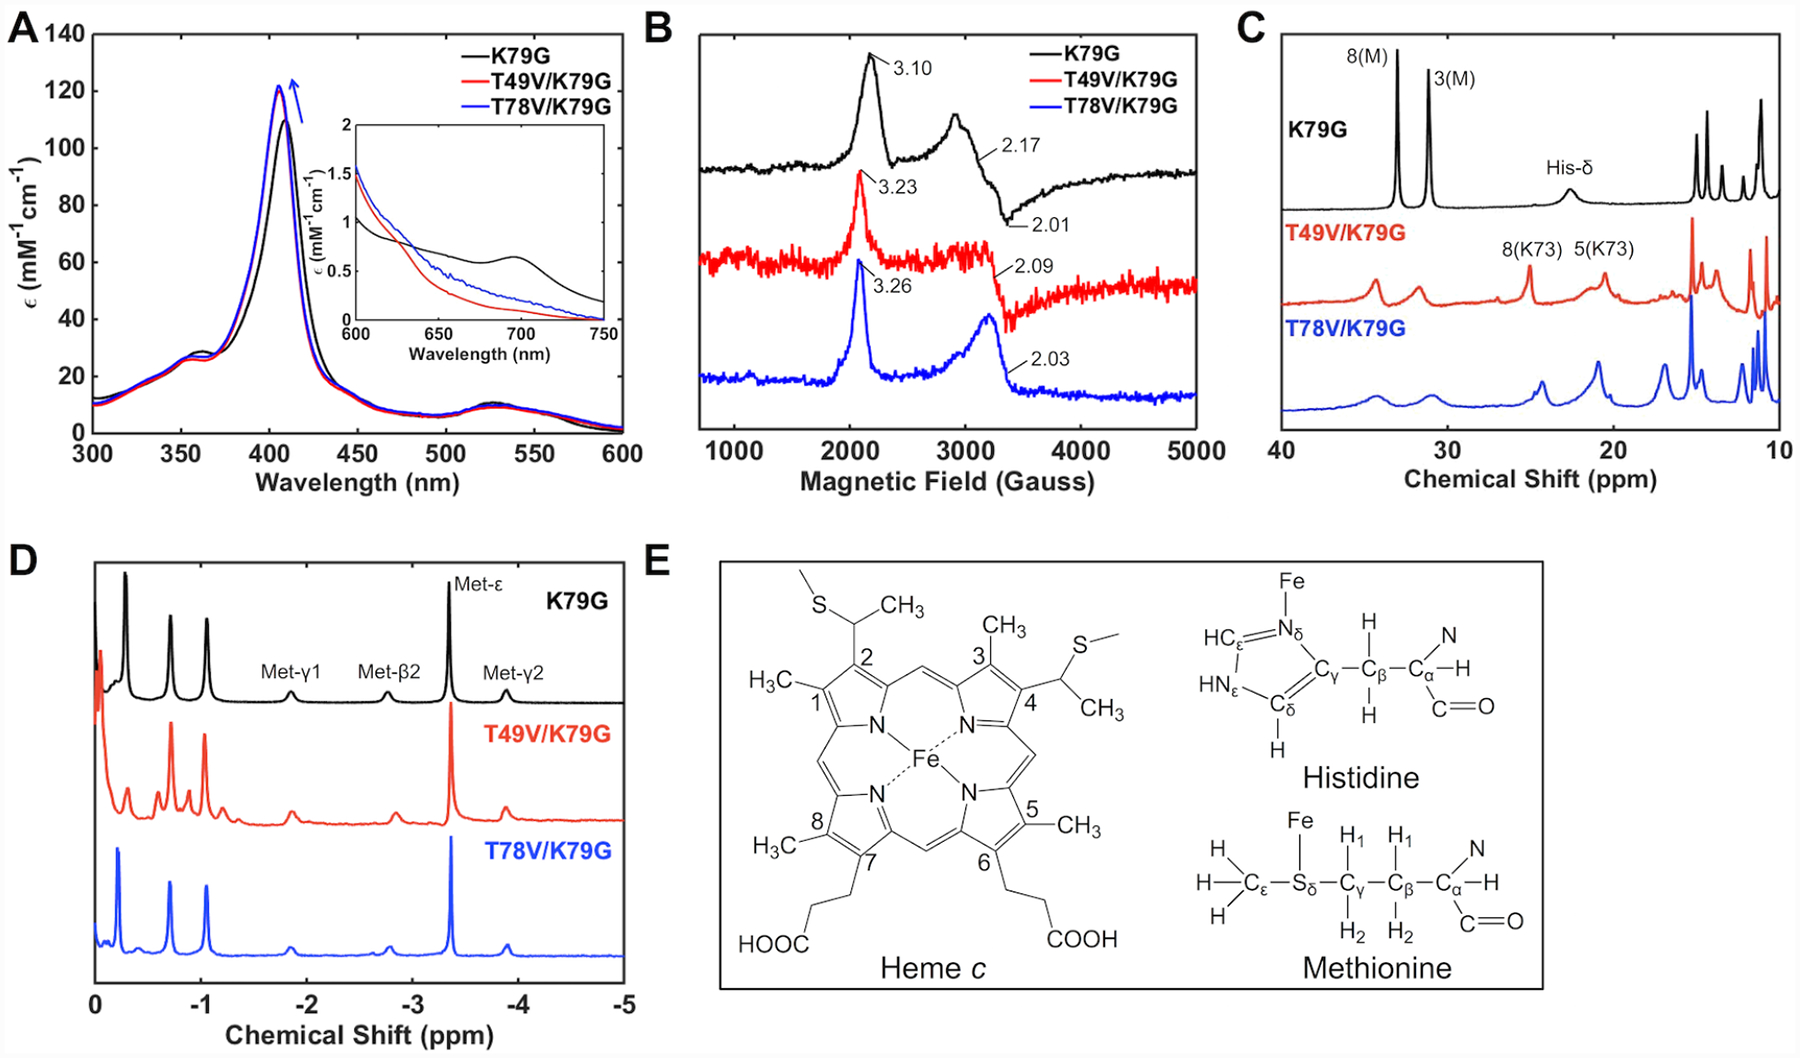
Figure 3.

Spectra of K79G (black), T49V/K79G (red), and T78V/K79G (blue) at pH 7.4. (A) Electronic absorption spectra of ferric proteins at 22 ± 2 °C. The arrow indicates a shift in the position of the Soret band. The inset is the comparison of charge-transfer bands at 695 nm. (B) EPR spectra of ferric proteins at 10 K. 1H NMR spectra of (C) ferric and (D) ferrous proteins at pD (pH) 7.4 and 25 °C. (E) Structures of heme, Met, and His showing the labeling nomenclature. Numbered peaks correspond to protons of heme methyl groups, with the identity of the axial ligand (M = Met, K = Lys) in parentheses.
