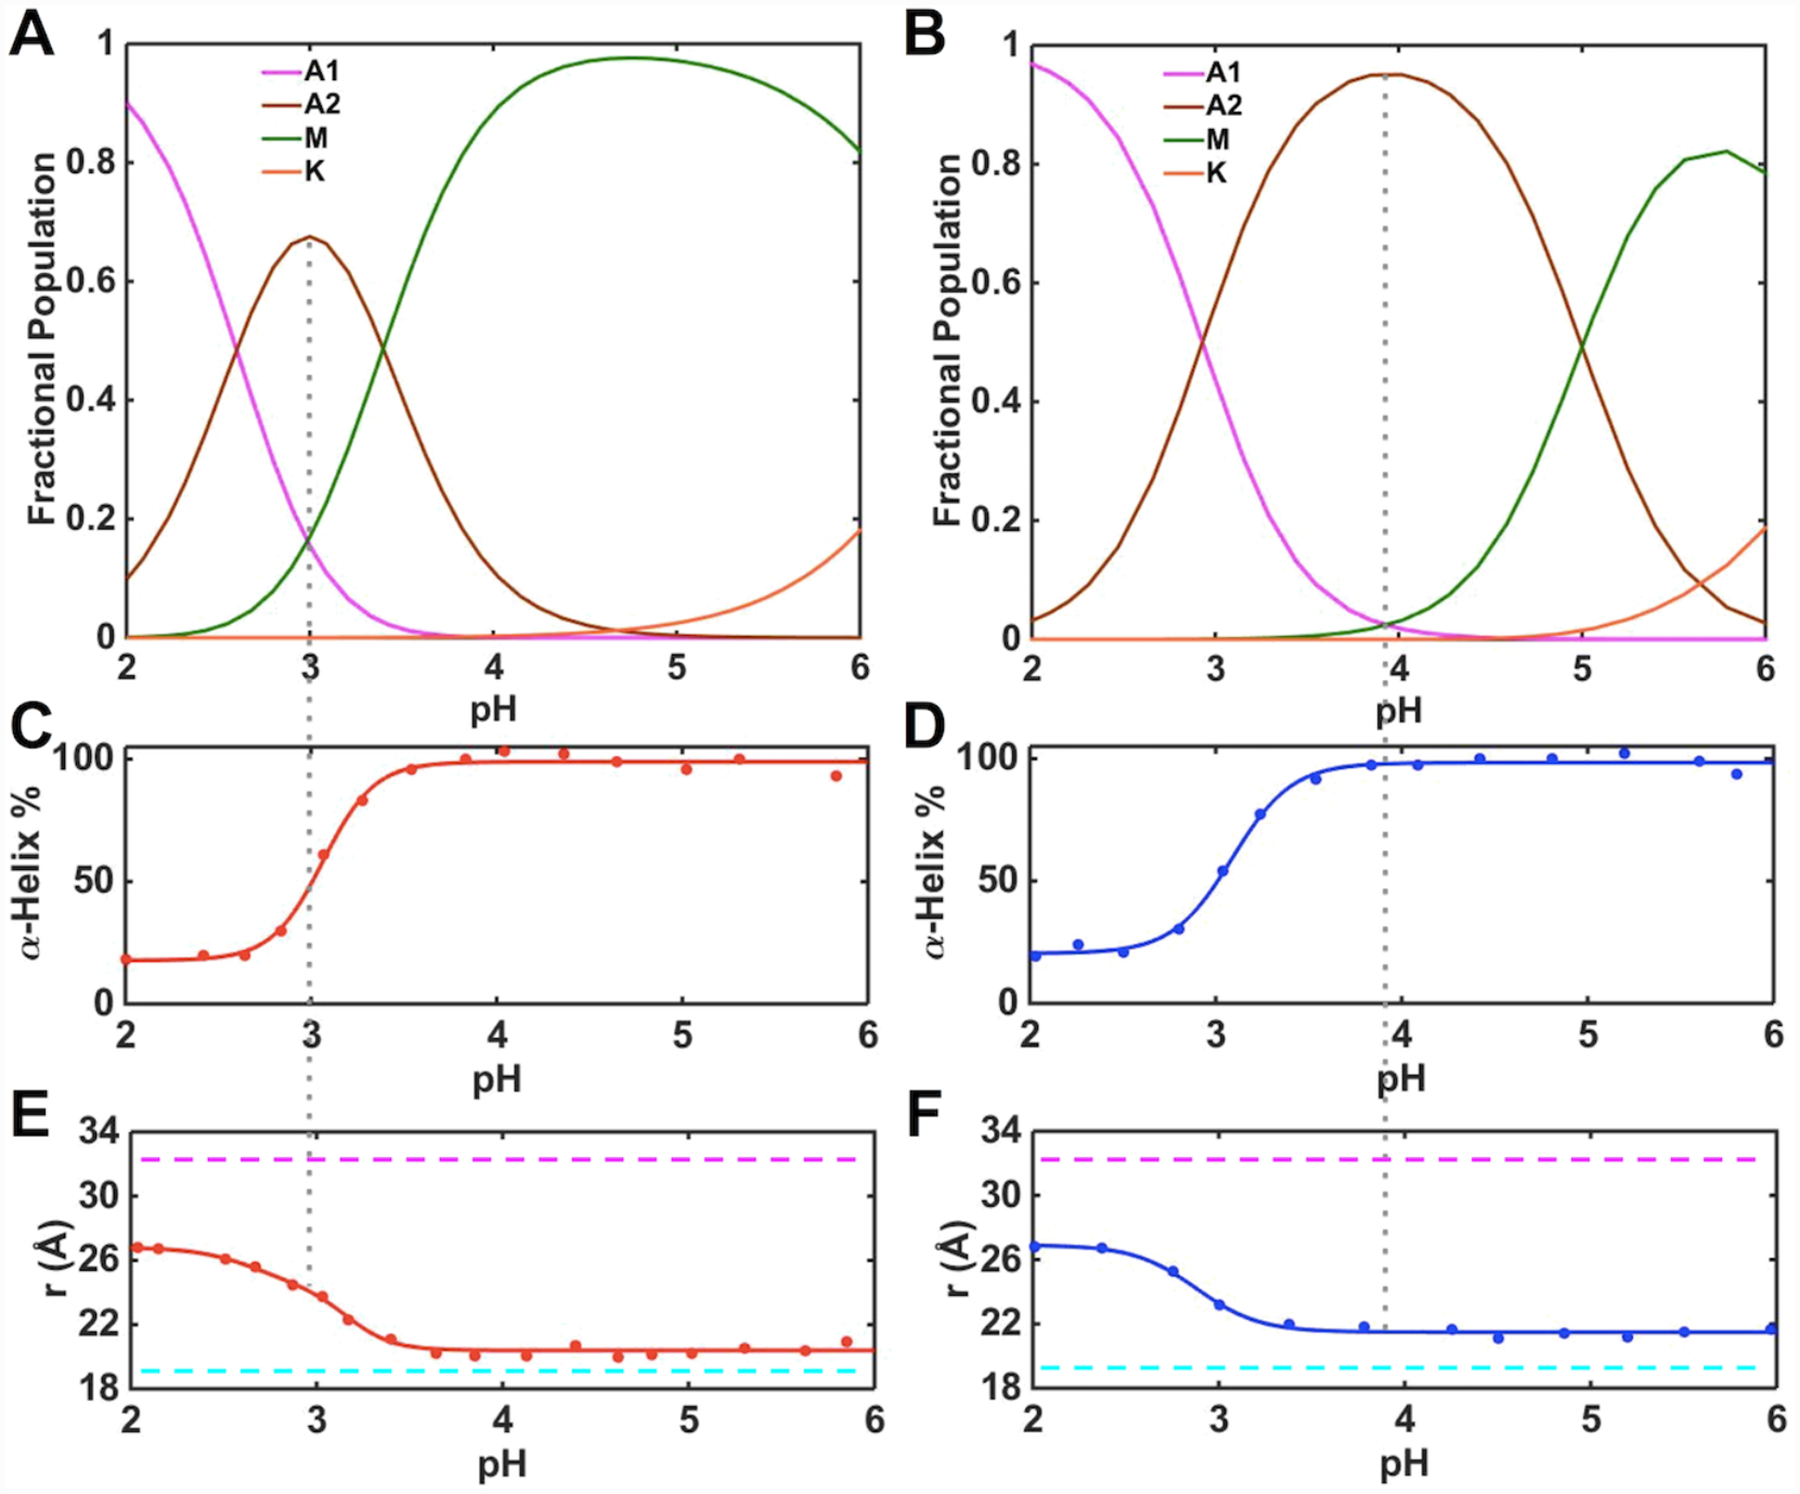
Figure 7.

Changes in the heme iron ligation and properties of the polypeptide fold in ferric (A, C, E) T49V/K79G and (B, D, F) T78V/K79G in the pH range from 2 to 6. (A, B) Fractional populations of differently-ligated heme iron species. (C, D) Percentage of the α-helical content relative to that at pH 6.0. (E, F) Distances between Trp59 and heme calculated from the fluorescence data. The magenta and cyan dashed lines indicate the distance between Trp59 and heme in fully unfolded (33 Å) and fully folded (18.8 Å) K79G, respectively. The gray dashed line represents the pH condition under which the A2 state is most populated.
