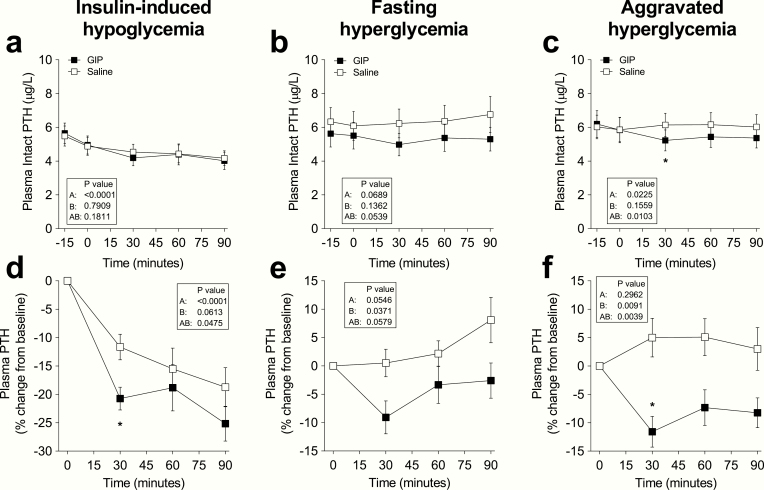
Figure 3.
Plasma concentrations of PTH levels during iv infusion of GIP (black squares) or saline (white squares) and expressed as (a-c) absolute plasma concentration or (d-f) percent of baseline during 6 separate days with either (a, d) insulin-induced hypoglycemia, (b, e) fasting hyperglycemia, or (c, f) aggravated hyperglycemia, respectively. Data are means ± SEM. Statistical analyses were done with repeated-measures ANOVA reporting P values for (A) differences over time, (B) between interventions (i.e., GIP or placebo), and (AB) for the interaction of intervention with time. Significant differences are indicated by asterisks according to Sidak’s multiple comparisons test: *P < 0.05. GIP, glucose-dependent insulinotropic polypeptide.

