
Figure 2.
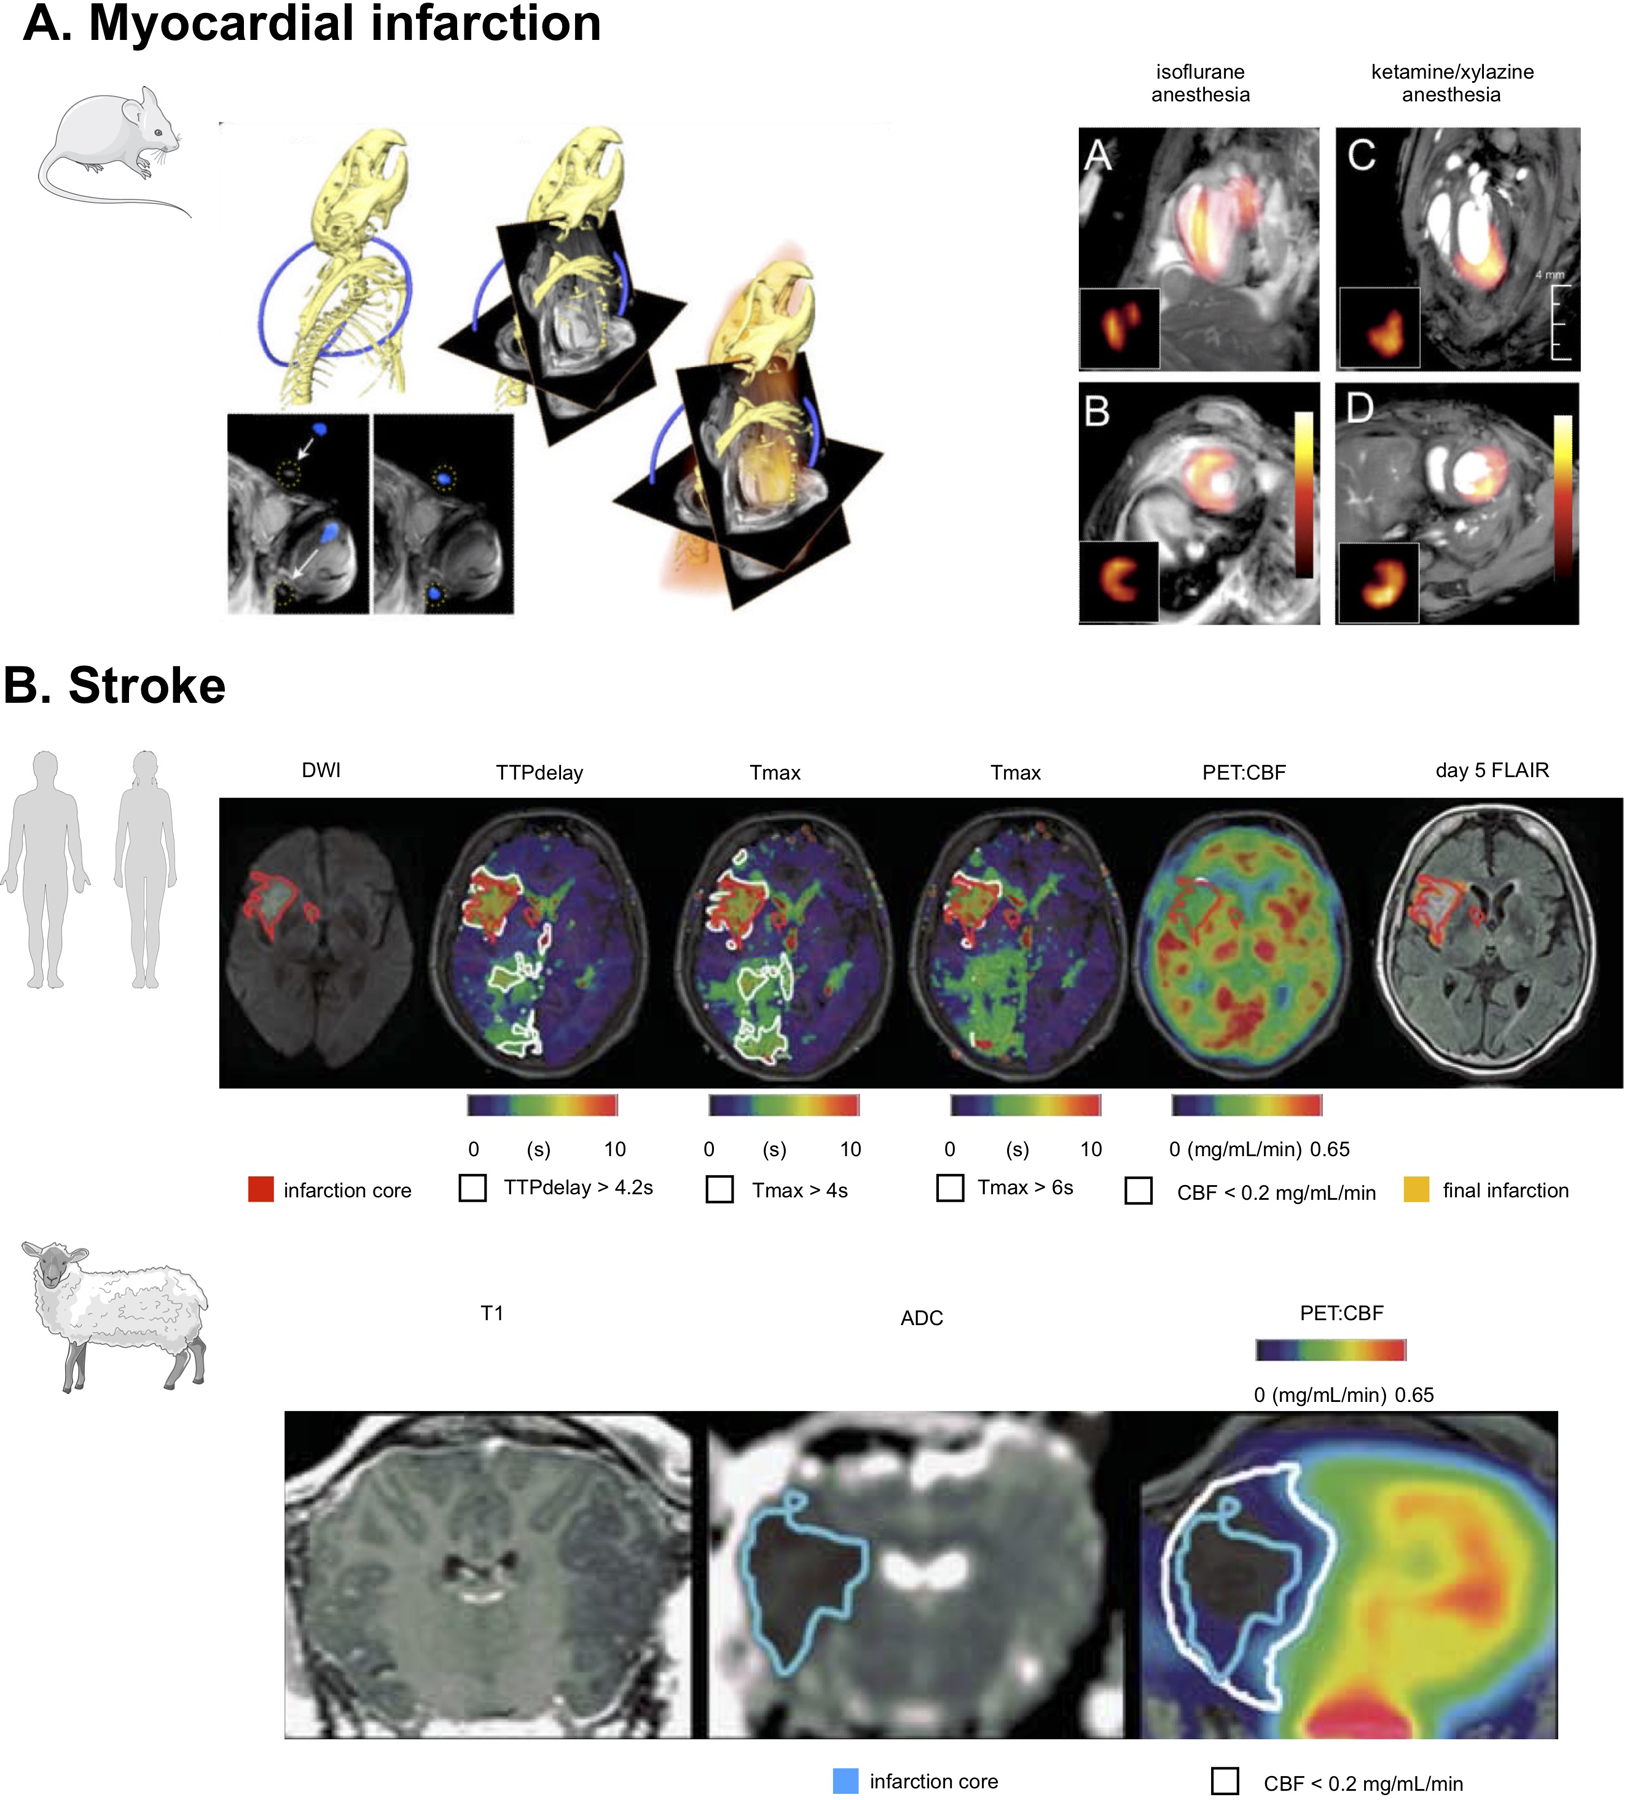
(A) PET/MRI in a mouse with myocardial infarction. PET and MR data was acquired on two separate scanners, and then fused after a process of co-registration aided by a system of fiducial markers. On the left, three-dimensional CT data show the skeleton and a part of the fiducial marker in blue. This allows fusion of CT and MRI matrices, as shown in the center. On the right side, PET data together with angled MR images used during cardiac MRI acquisition are shown. At the far right, fused MR and PET data in a mouse with myocardial infarction are displayed and show different patterns of 18F-FDG uptake under different anesthesia regimens. Adapted from Lee et al35 (B) The top row shows [15O]H2O PET/MRI in a typical human middle cerebral artery (MCA) infarction. Diffusion-weighted MRI shows a disturbance in the right MCA territory (red-bordered area, 22 mL). Perfusion[MRI] flow delays in the right posterior cerebral artery territory did not result in a perfusion restriction according to PET and may thus indicate sufficient collateral flow secondary to the MCA occlusion. The bottom row, shows [15O]H2O PET/MRI 4.5 hours after middle cerebral artery occlusion in sheep. ADC imaging indicated a respective disturbance (blue-bordered area). According to perfusion[PET], penumbral volume was 9.8mL (white-bordered area in upper row). Adapted from Werner et al.40