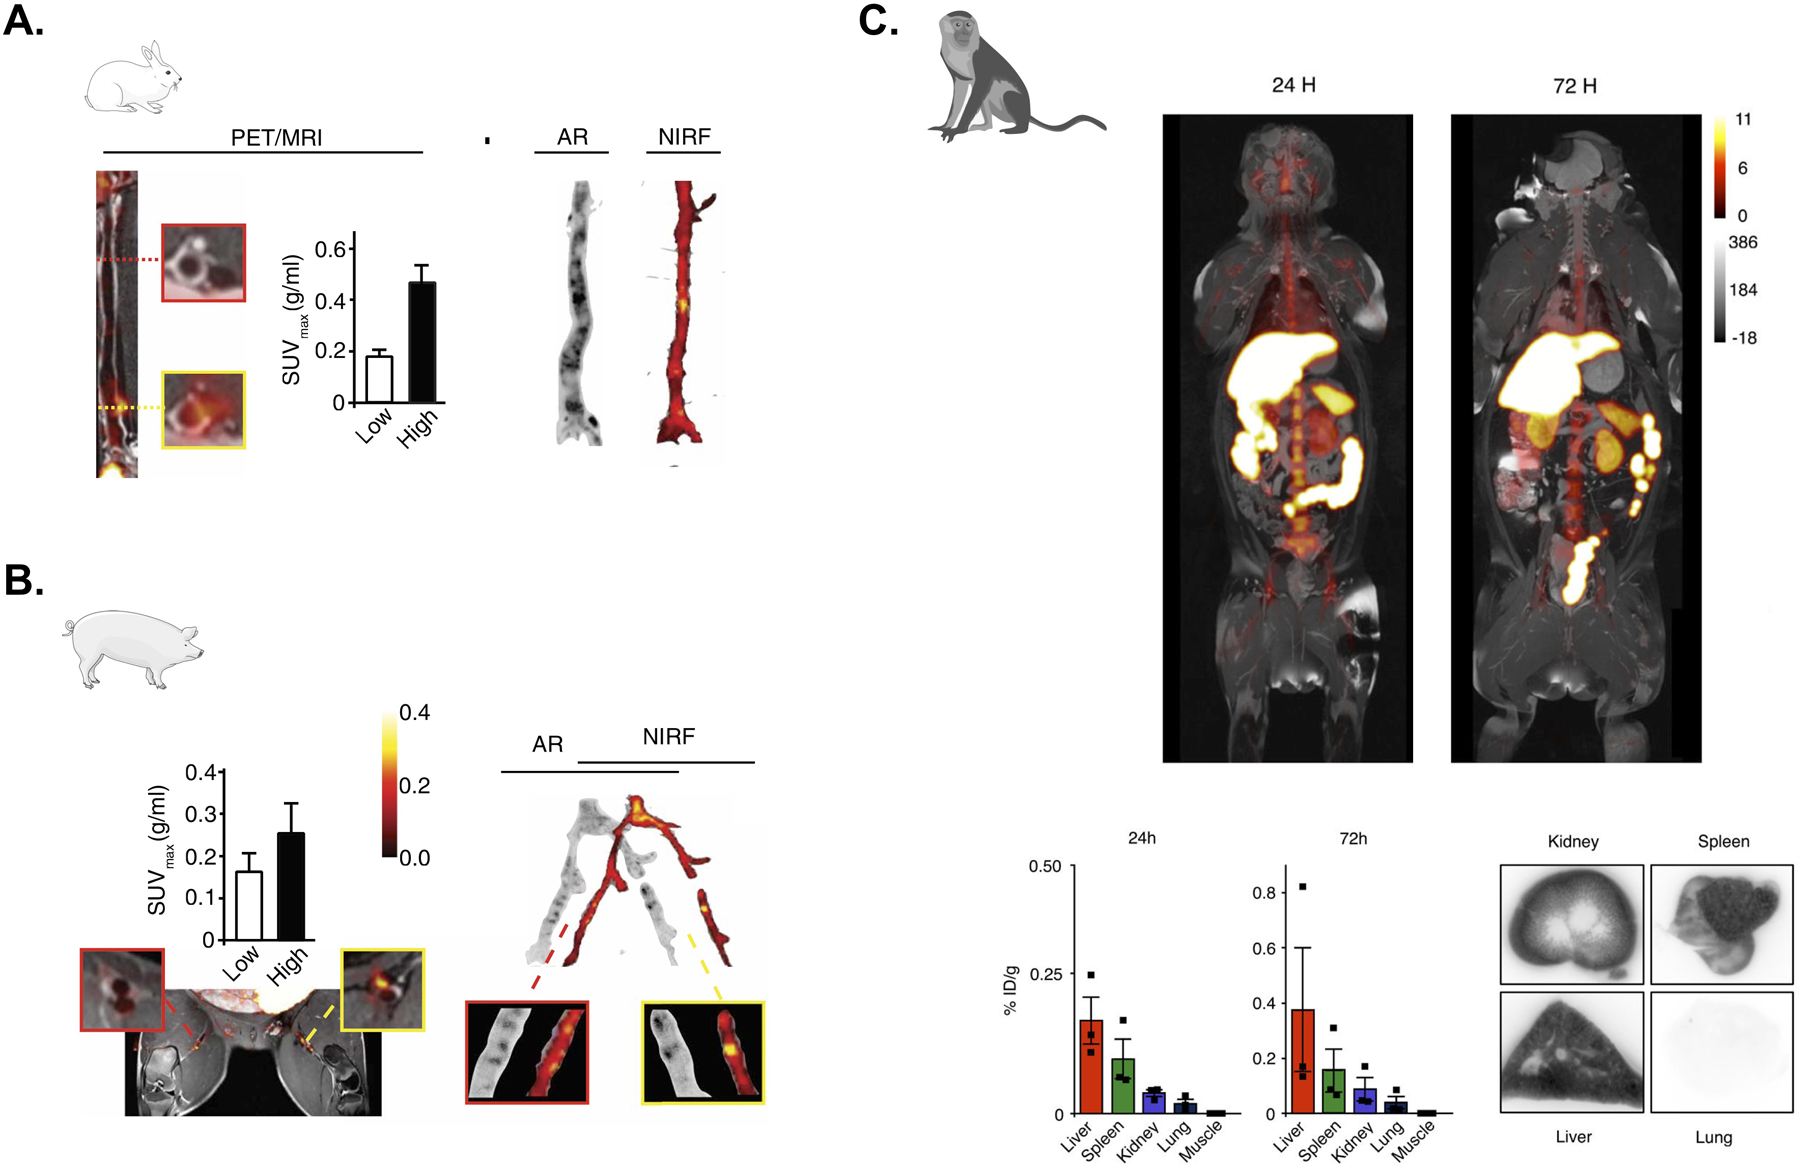
Figure 3.

(A) Left, PET/MRI assessment of plaque targeting and quantification of standardized uptake values (SUVs) in a representative rabbit 48 hours after injection of 89Zr-labeled S-HDL. Low and high uptake regions are respectively showin in the red- and yellow-bordered squares. Right, the regional distribution of S-HDL in atherosclerotic rabbits is shown by autoradiography (AR; 89Zr-labeled S-HDL) and near-infrared fluorescence (NIRF; DiD-S-HDL) 48 hours after injection. Adapted from Binderup et al.49 (B) Left, PET/MRI assessment of plaque targeting and quantification of standardized uptake values (SUVs) in a representative pig 48 hours after injection of 89Zr-labeled S-HDL. Low and high uptake regions are respectively showin in the red- and yellow-bordered squares. Right, the regional distribution of S-HDL in atherosclerotic pigs is shown by autoradiography (AR; 89Zr-labeled S-HDL) and near-infrared fluorescence (NIRF; DiD-S-HDL) 48 hours after injection. Adapted from Binderup et al.49 (C) Six non-human primates were infused with 89Zr-labeled TRAF6i-HDL (1 mg/kg). Dynamic PET images were acquired within 60 minutes after infusion. Static PET/MRI scans were performed at 24, 48 and 72 hours. NHP were sacrificed after 72 hours. Organs were collected for ex vivo analysis. Static PET/MR images at 24 and 72 hours show the distribution and accumulation of TRAF6i-HDL (upper panel). Gamma counting shows nanoparticle biodistribution in NHPs at 24 and 72 hours post administration of 89Zr-labeled TRAF6i-HDL (n=3) (lower panel). Adapted from Lameijer et al.50
