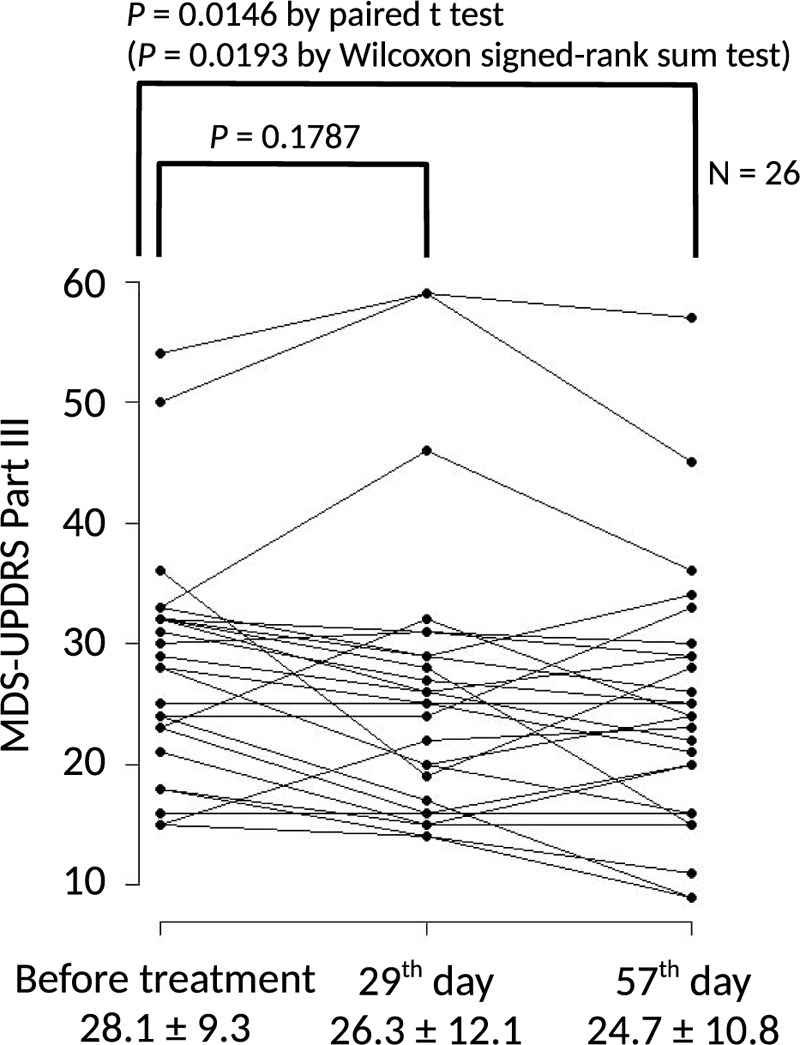
Figure 2.

Pre- and post- treatment MDS-UPDRS Part III scores. Graph showing the change of MDS-UPDRS Part III score in each of the 26 patients. Primary endpoint was the change of MDS-UPDRS Part III score from before beginning treatment to 57th day; significance was calculated using a paired t-test with 25 degrees of freedom. Results of the Wilcoxon signed-rank sum test are presented as an alternative non-parametric method. Values below the plot represent mean ± SD of the MDS-UPDRS Part III scores.
