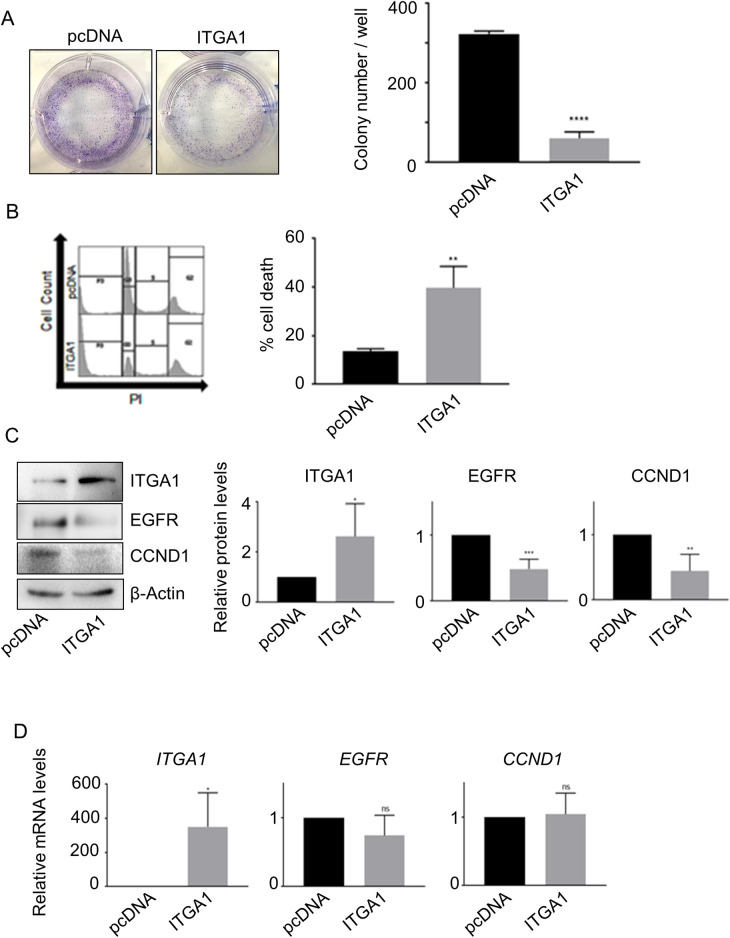
Fig 6. Alteration of the ITGA1-regulated network is implicated in cellular proliferation and transformation.
(A) 38HK were transfected with ITGA1 cDNA (ITGA1) or empty plasmid control (pcDNA). After zeocin selection, 38HK were fixed with crystal violet (left panel) and total colony number per well was counted (right panel). Data shown are the means of 3 independent experiments. ****, p<0.0001. (B) 38HK transfected with ITGA1 cDNA (ITGA1) or empty plasmid control (pcDNA) were fixed and stained with propidium iodide for flow cytometry analysis. The histograms (right) represent the means of the sub-G0 population of 3 independent experiments. **, p<0.01. (C and D) Total protein and mRNA extracts from transfected 38HK were analyzed by IB and RT-qPCR. (C) Protein band intensity was quantified and normalized to β-actin. (D) ITGA1, EGFR, and CCND1 mRNA levels were normalized to GAPDH. For (C) and (D), data shown are the means of 4 independent experiments *, p<0.05; **, p<0.01; ***, p<0.001; ns, not significant.

